Raspberry Pi Diagnostic Suite
Every board. 19 checks.
Automated 19-vector hardware quality assurance, real-time telemetry, and standardized RMA triage for single-board computers.
Up to 20 minutes by hand.19 checks. One button.
Technicians used to toggle pins from the command line and probe a 40-pin header with a multimeter, then plug in each peripheral by hand. Run All now works through the platform, radios, storage, compute and power in four phases.1
- 1Platform & Ports10 tests
- 2Radio & Network3 tests
- 3Storage3 tests
- 4Compute & Power3 tests
- The storage tests run apart from the network tests, and the power audit runs alone, so neither skews the other.
One slipped probe.No probes. No risk.
Pins are read with the board’s own internal pull-ups, and every line is released straight afterwards, even if a read fails. No probes and no loopback wiring.
Example, pin 7 (GPIO 4): stuck low.Reported pin by pin, not as a generic “GPIO error”, so a technician sees exactly which line failed.
Every board, one tool.One suite for every Pi.
On a Pi 5 it talks to the RP1 directly and finds the right GPIO chip on its own. On older boards it falls back to the libraries they already support.
- Raspberry Pi 5lgpio on the RP1, chip found automatically
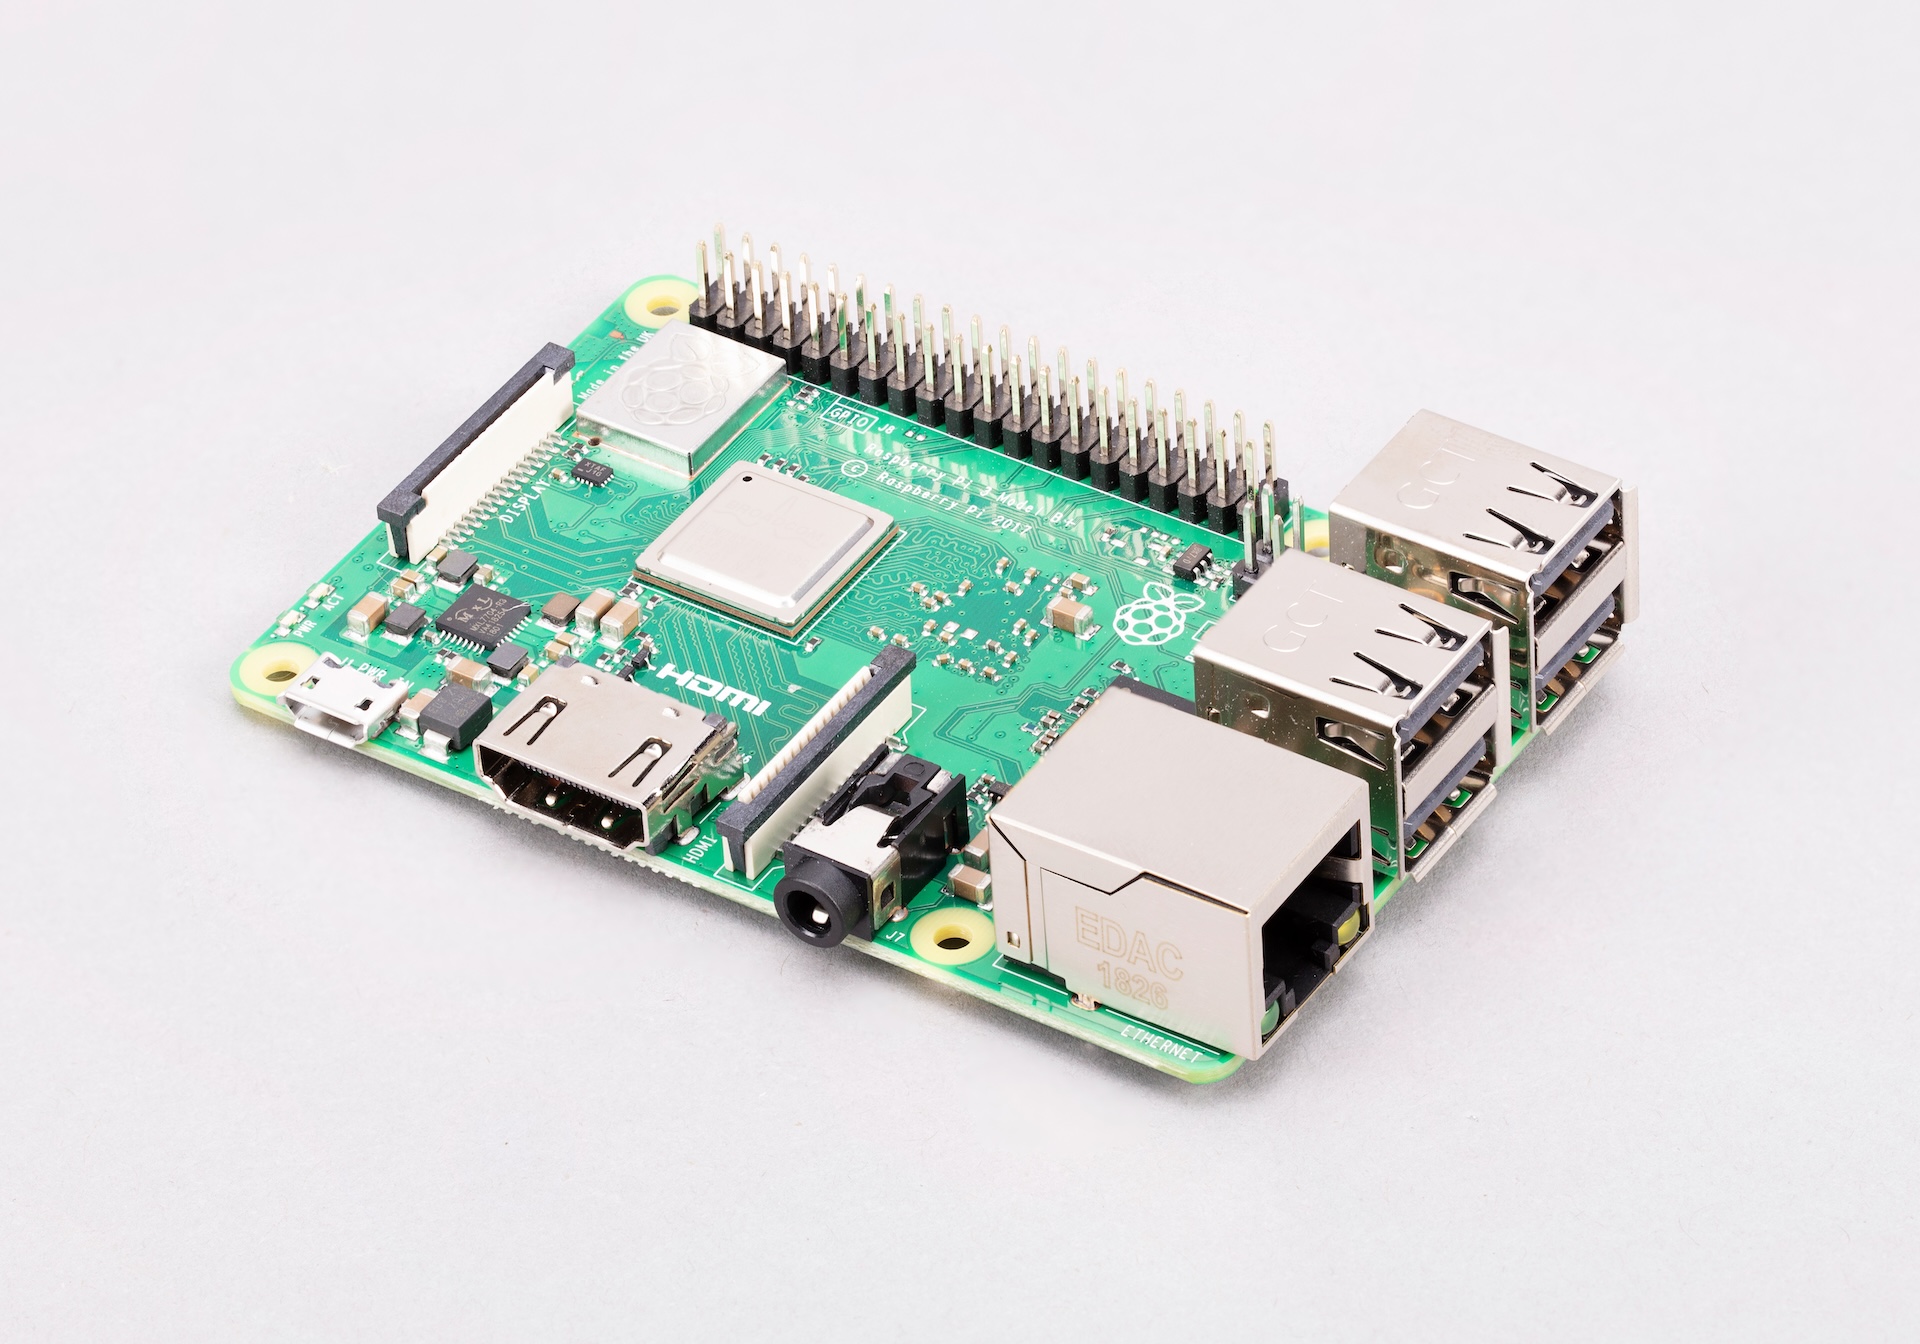
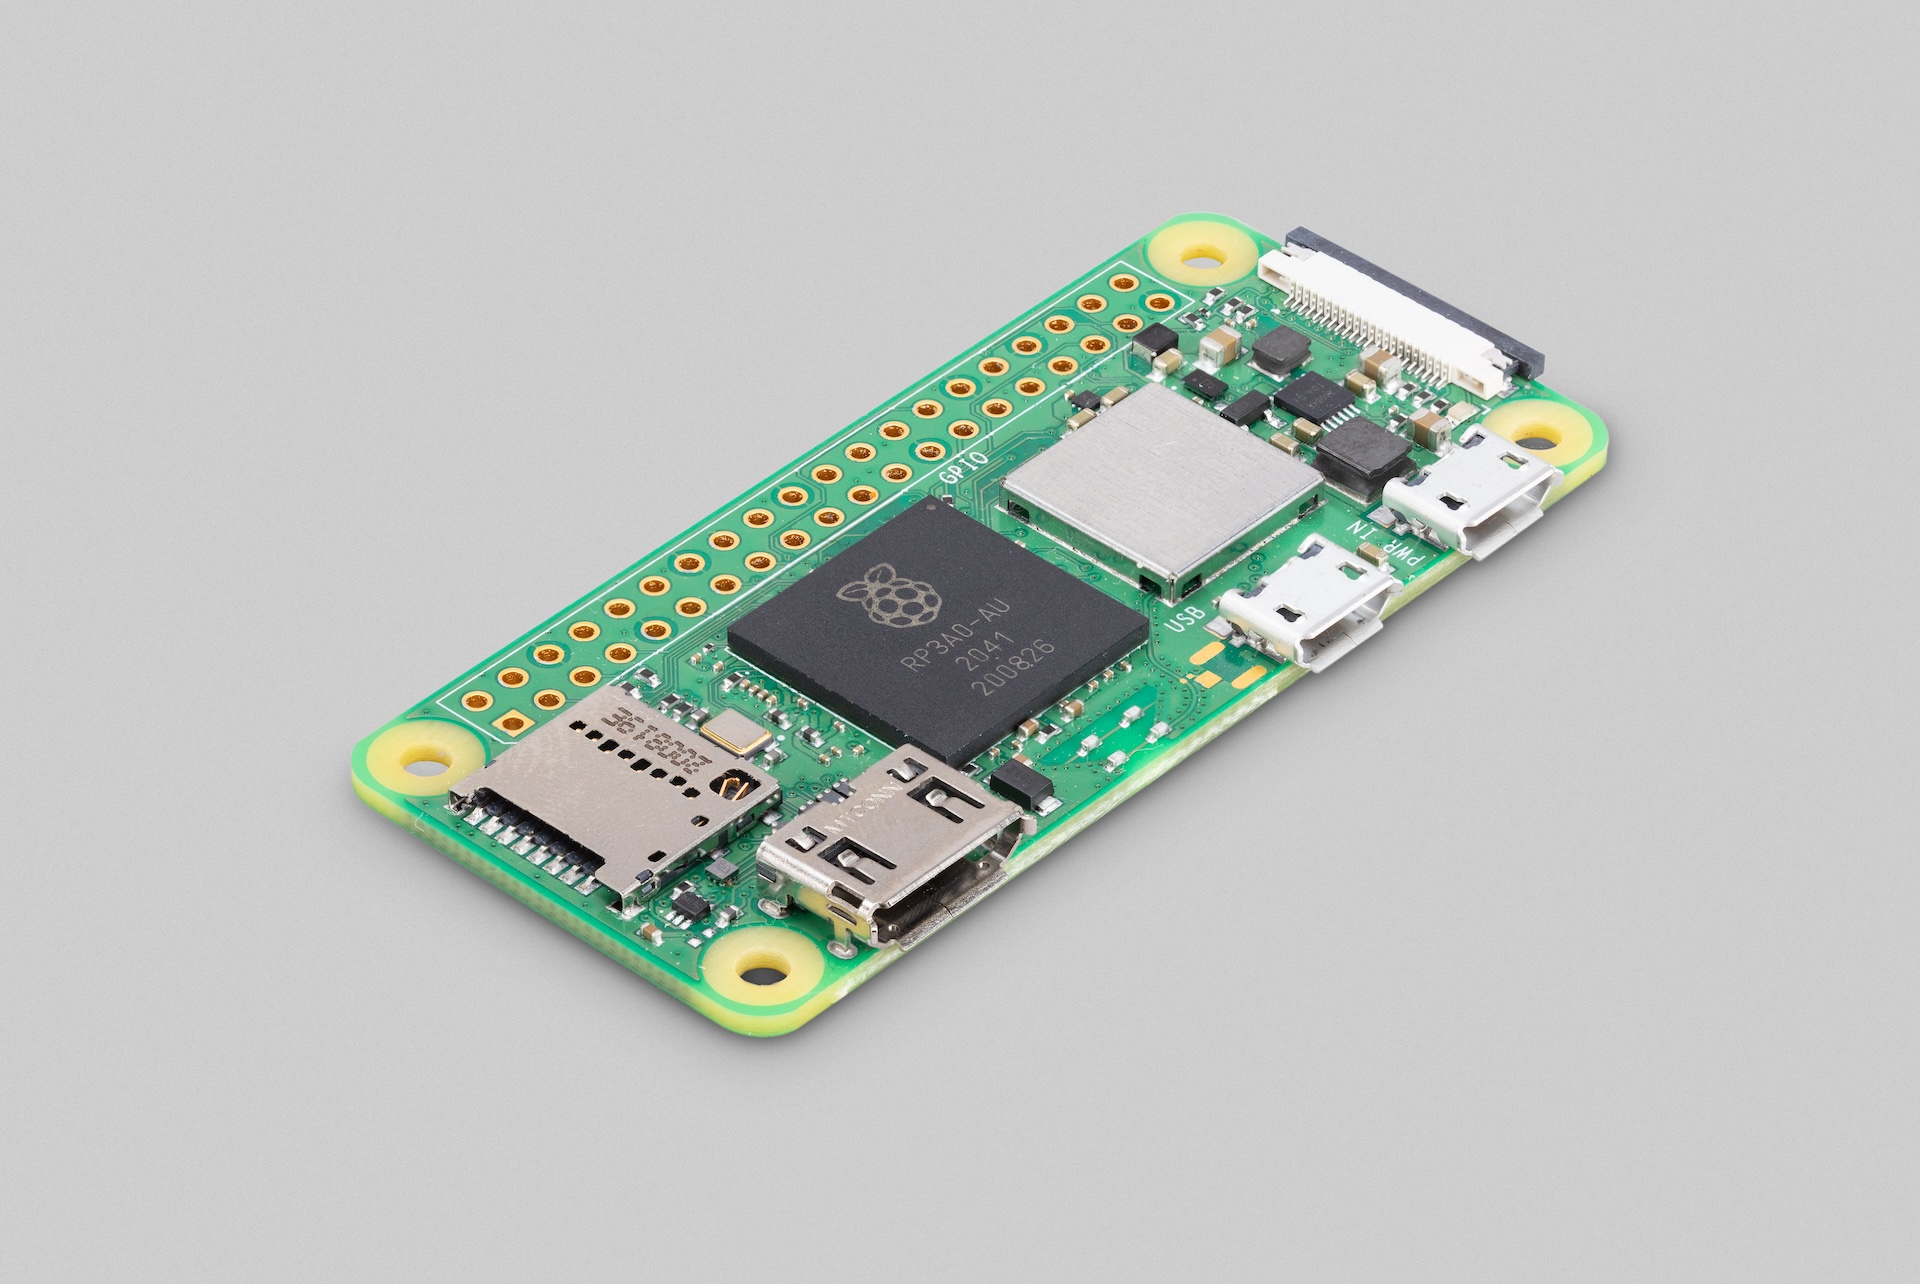
- Pi 4, 3 and Zero 2 Wgpiozero, with lgpio or RPi.GPIO as backups
- The right driver is picked automatically at start-up.
Nothing on record.A signed report for every board.
Every session is stored against the board’s serial number, so a unit’s whole test history is one click away. Each one prints as a two-page manifest and certificate with a technician sign-off, sealed with an HMAC-SHA256 that changes if stored results are edited.2
RMA test certificate
DOC-RMA-YYYYMMDD-XXXX
HMAC-SHA256 · record seal
See it in action.
Seven screens, from sign-in to the printable report. Sample data shown.
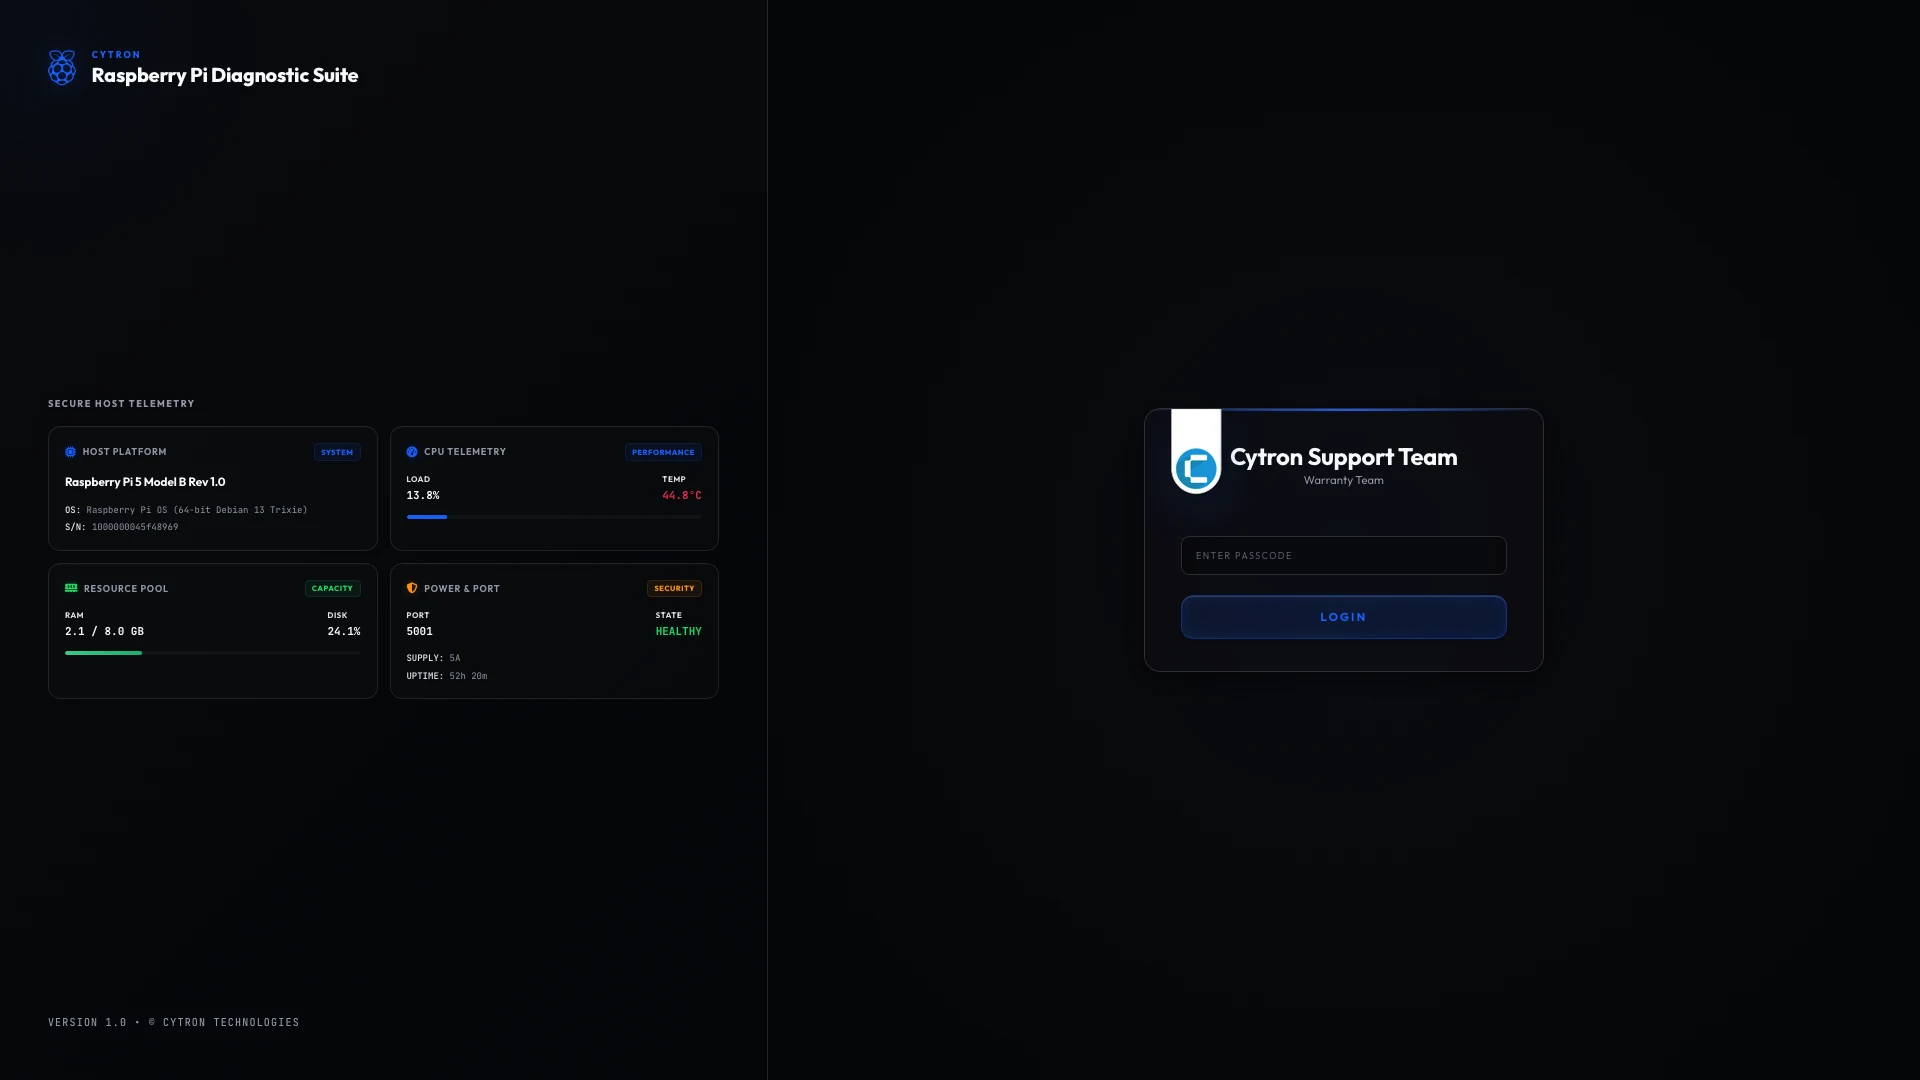
Sign in
A passcode keeps the bench private.
Even the sign-in screen shows live host telemetry: platform, CPU load and temperature, memory and disk, power and port.
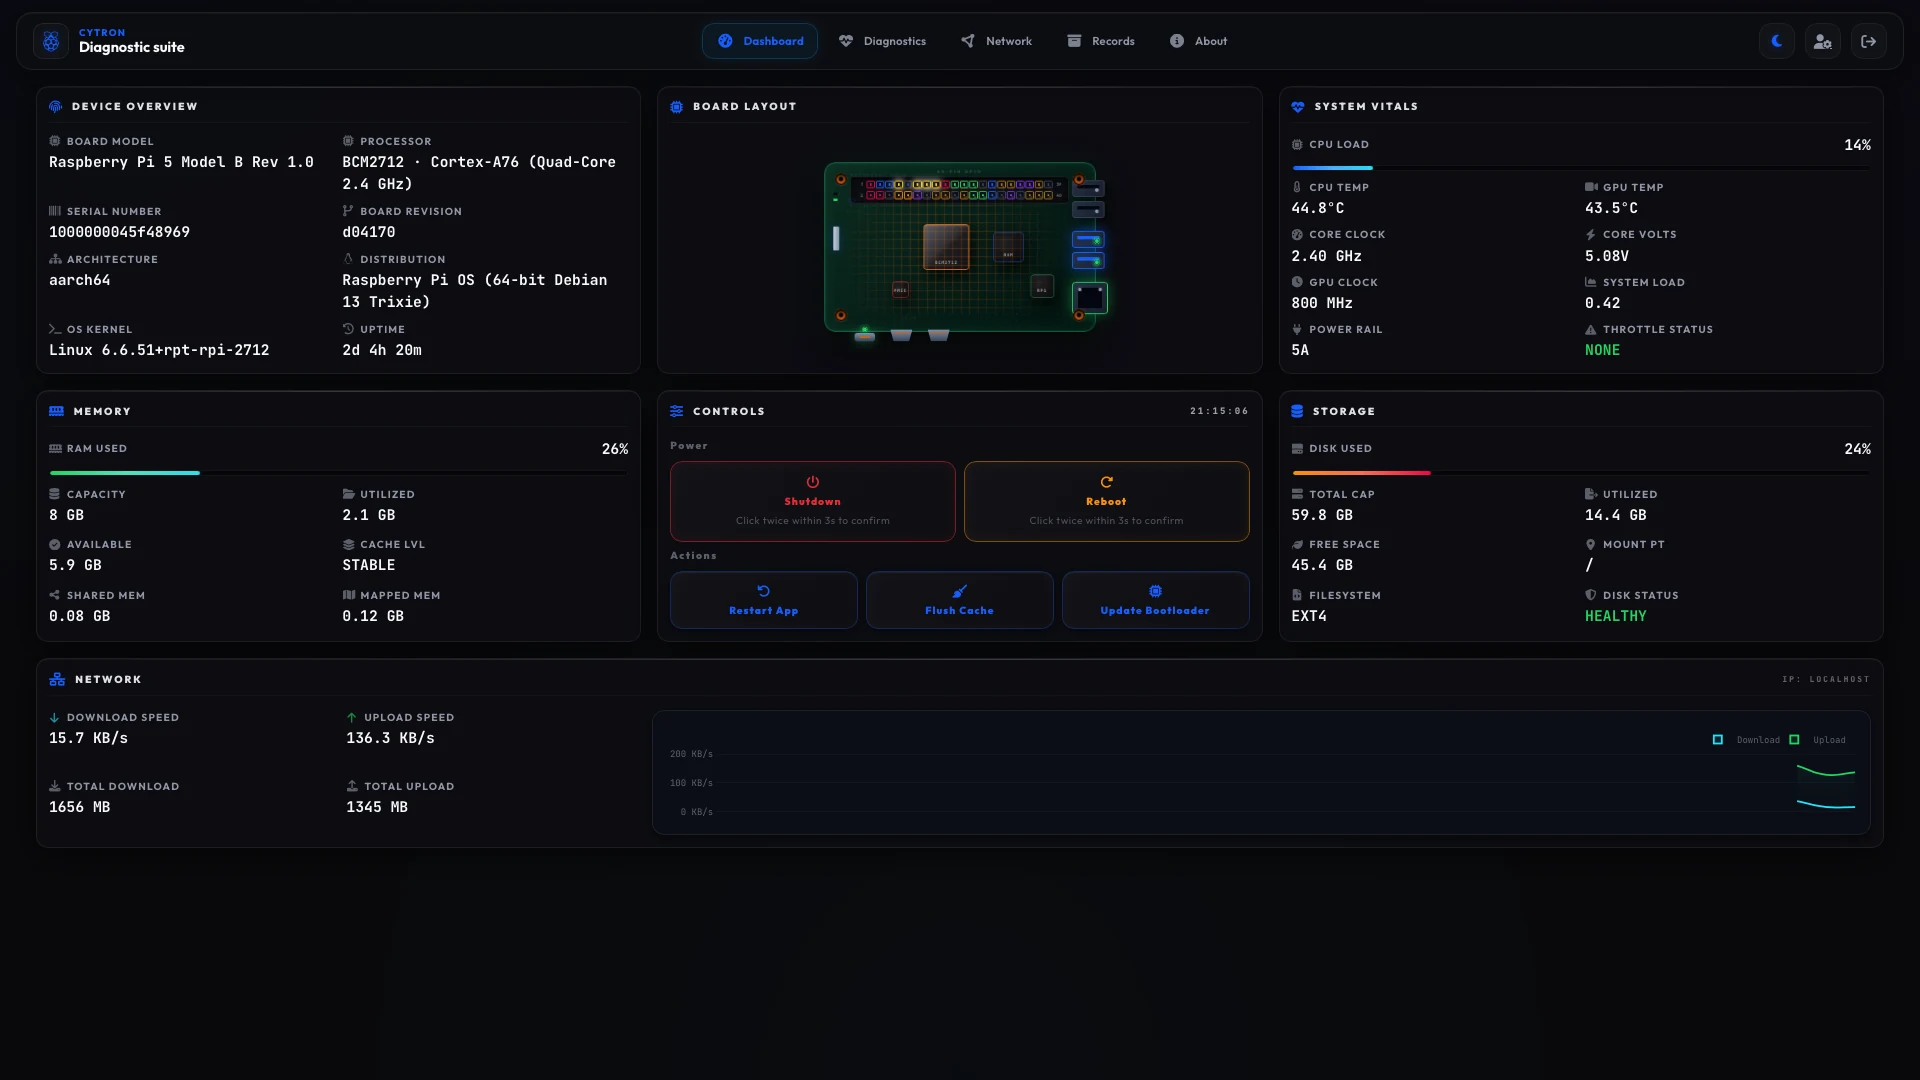
Dashboard
The board at a glance.
Device details, a live board layout, vitals, memory, storage and network, with shutdown, reboot, restart, cache and bootloader controls.
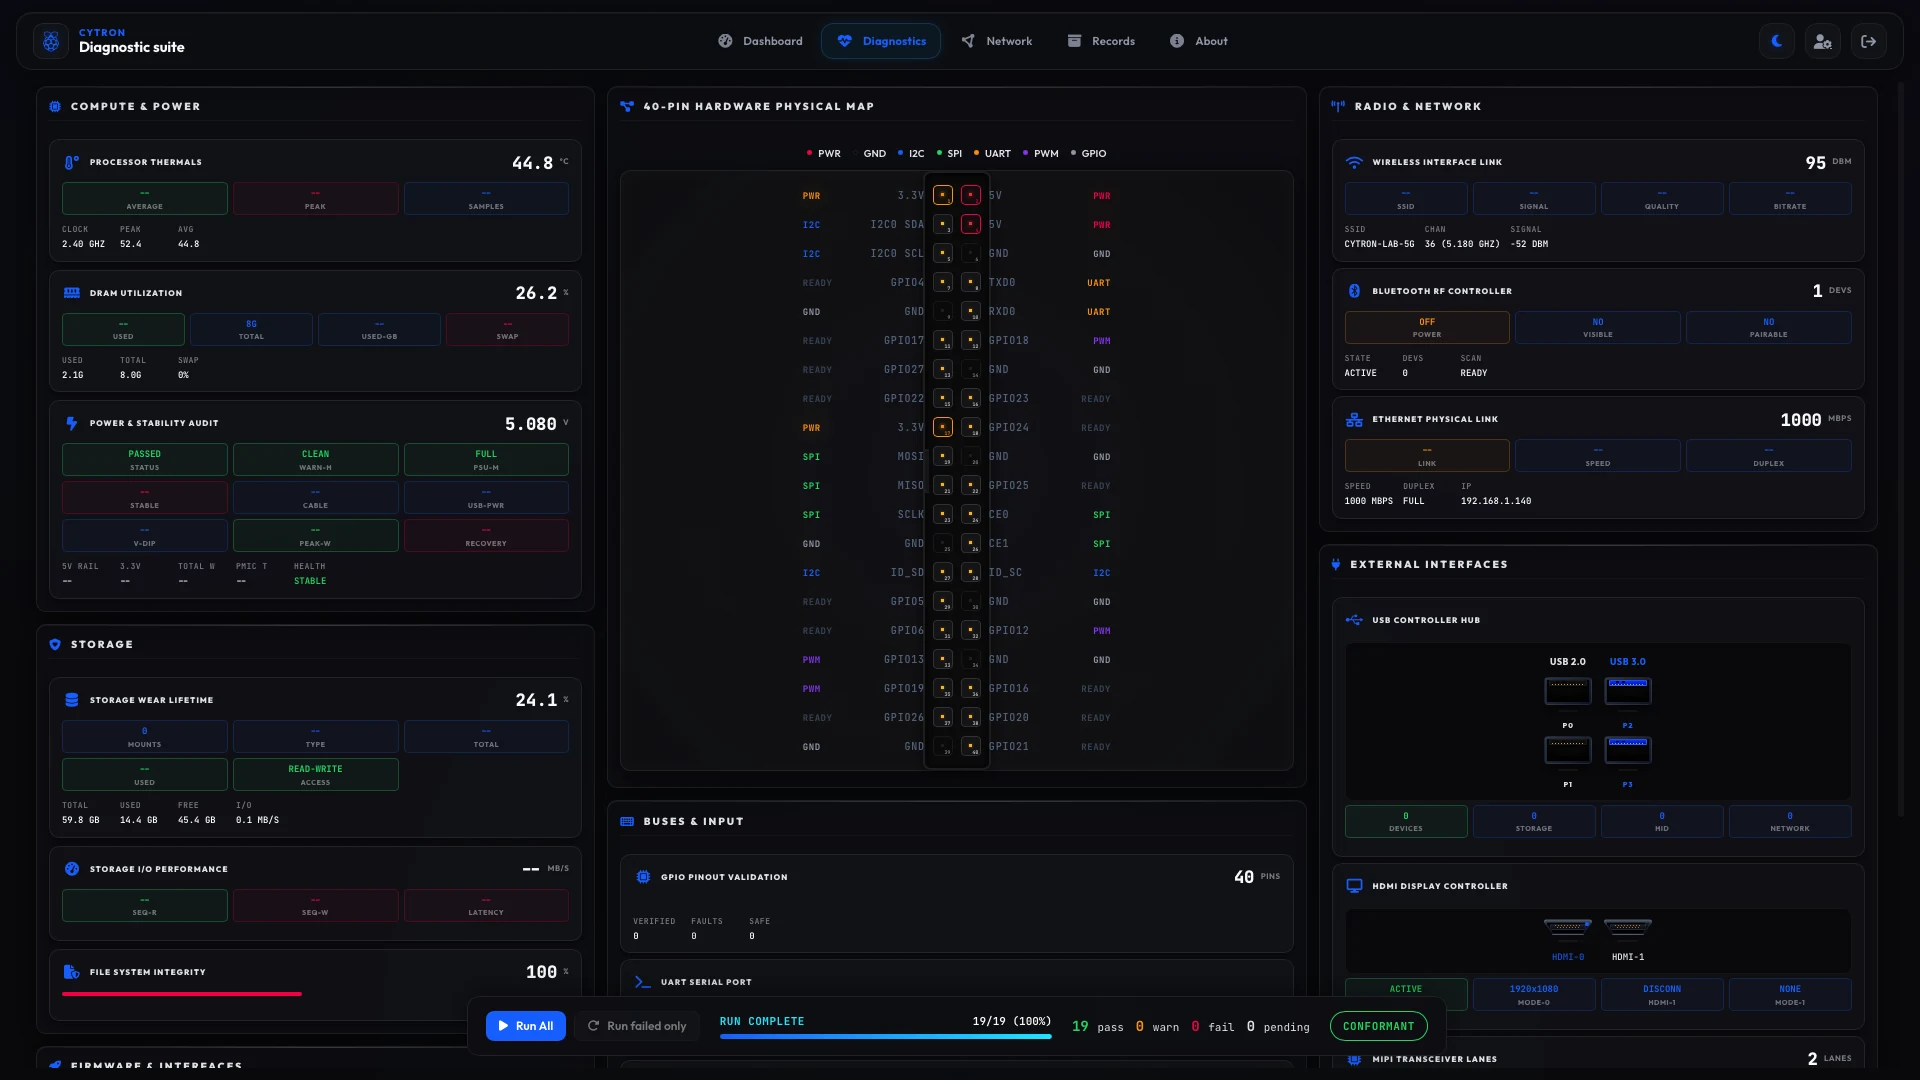
Diagnostics
Every subsystem on one page.
Compute, power and storage on the left, the 40-pin map in the middle, radios and external interfaces on the right, and the Run All bar at the bottom.
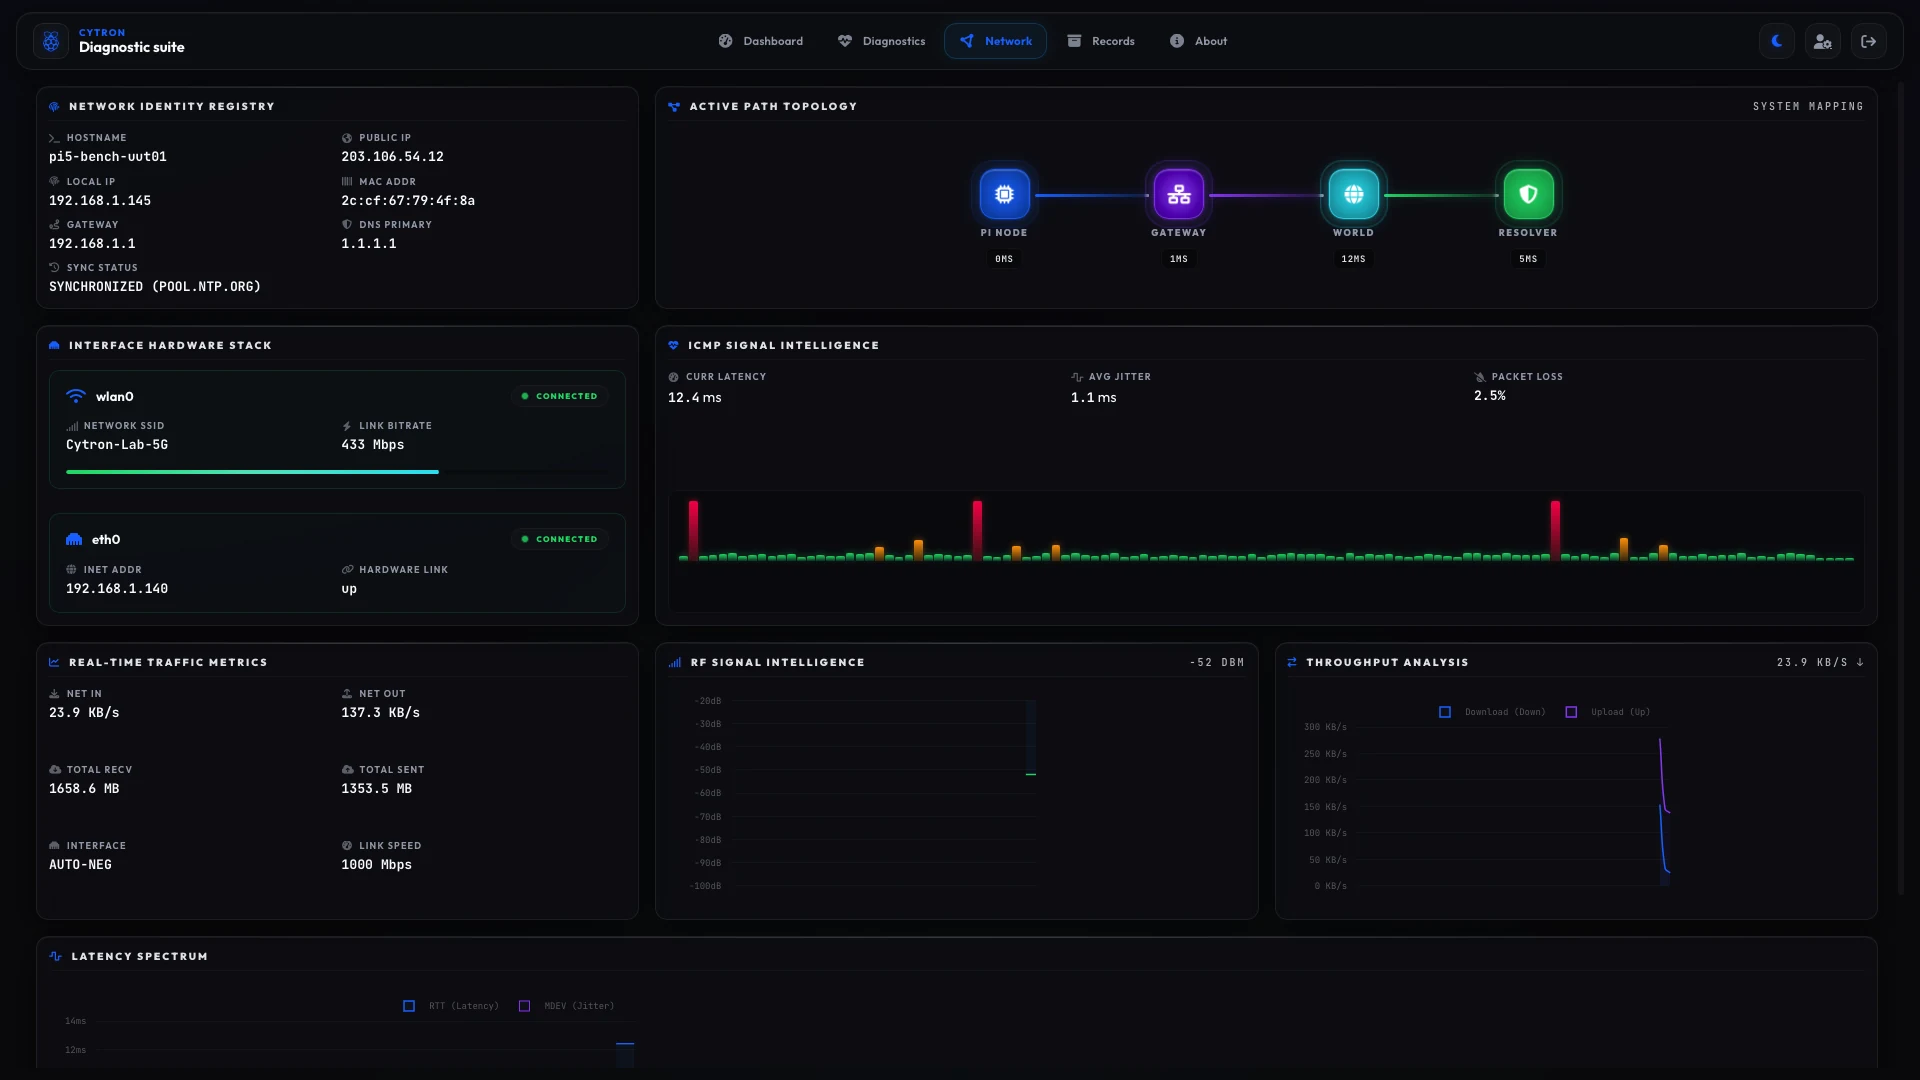
Network
Know the connection.
Identity and path, latency, jitter and packet loss, interface status, live traffic, signal strength and throughput.
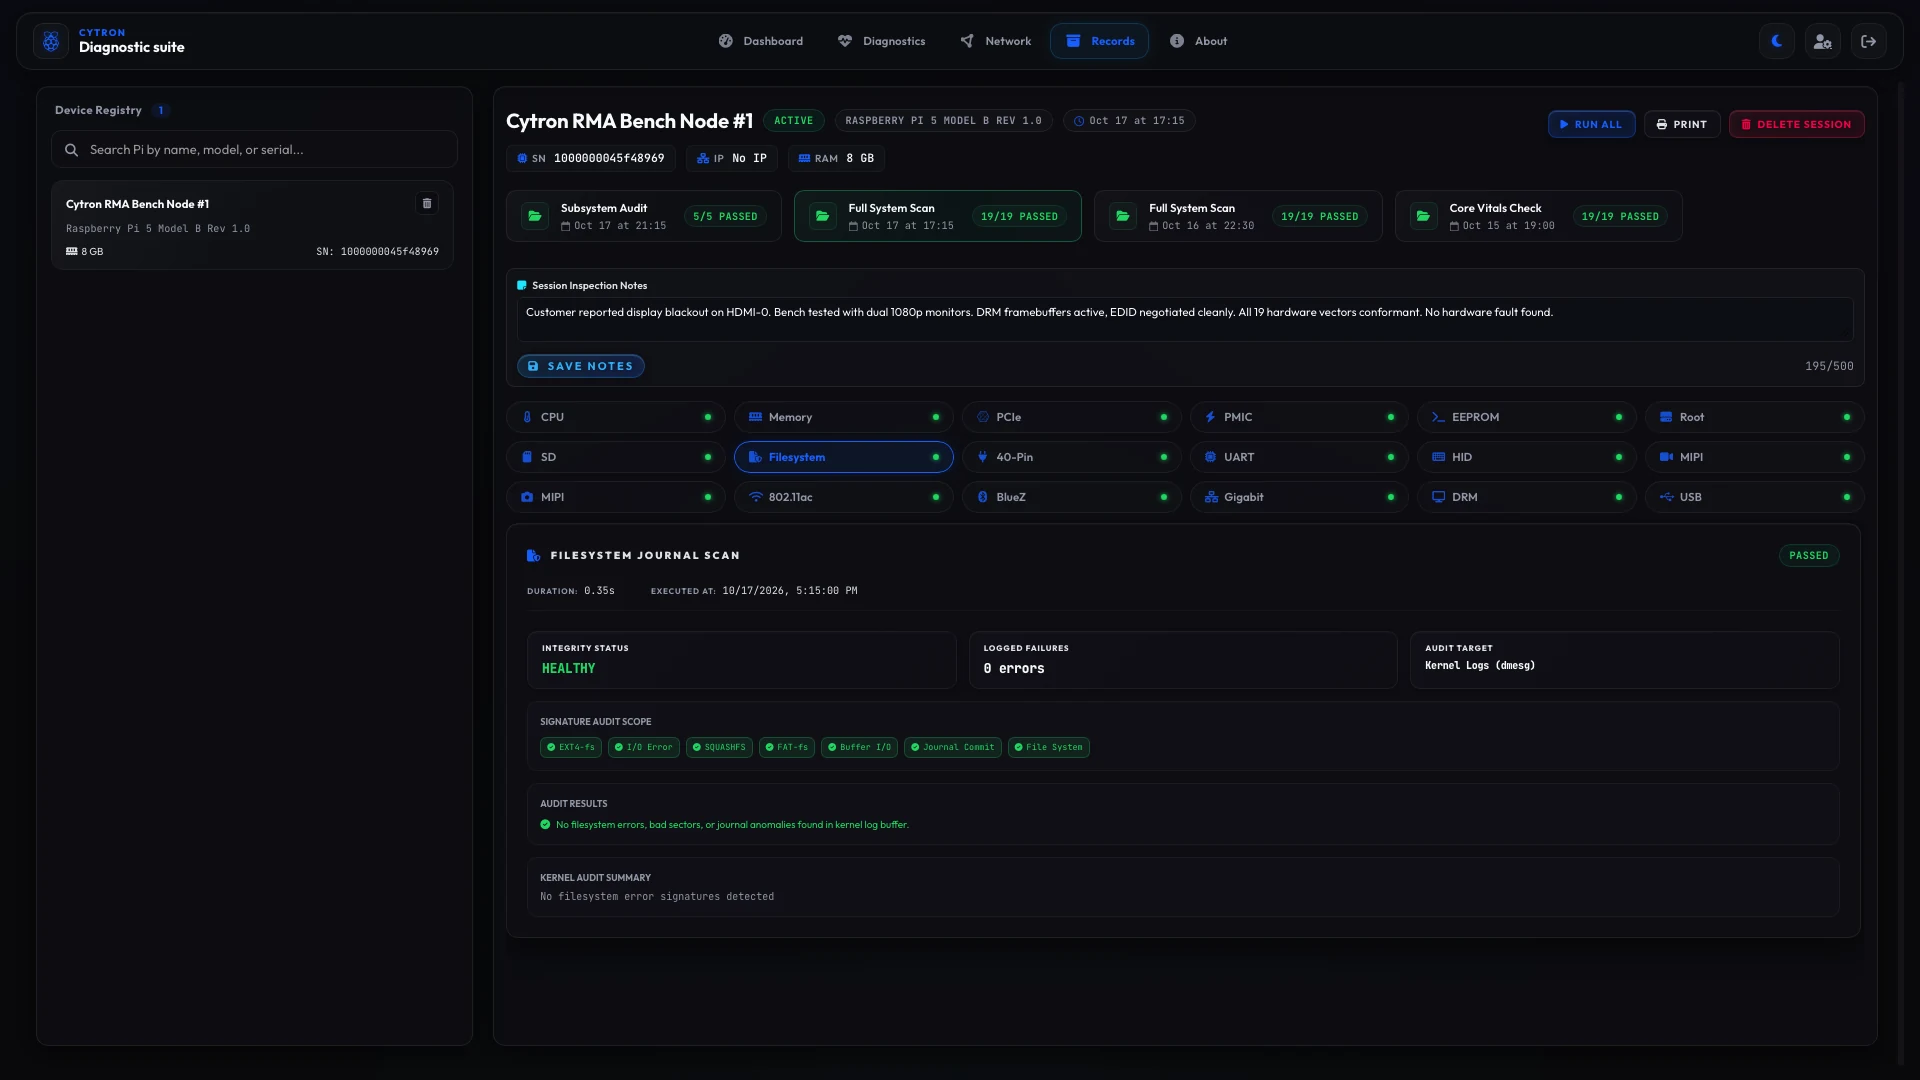
Records
Every session, every board.
A device registry, session history with inspection notes, and a result for each of the 19 subsystems.
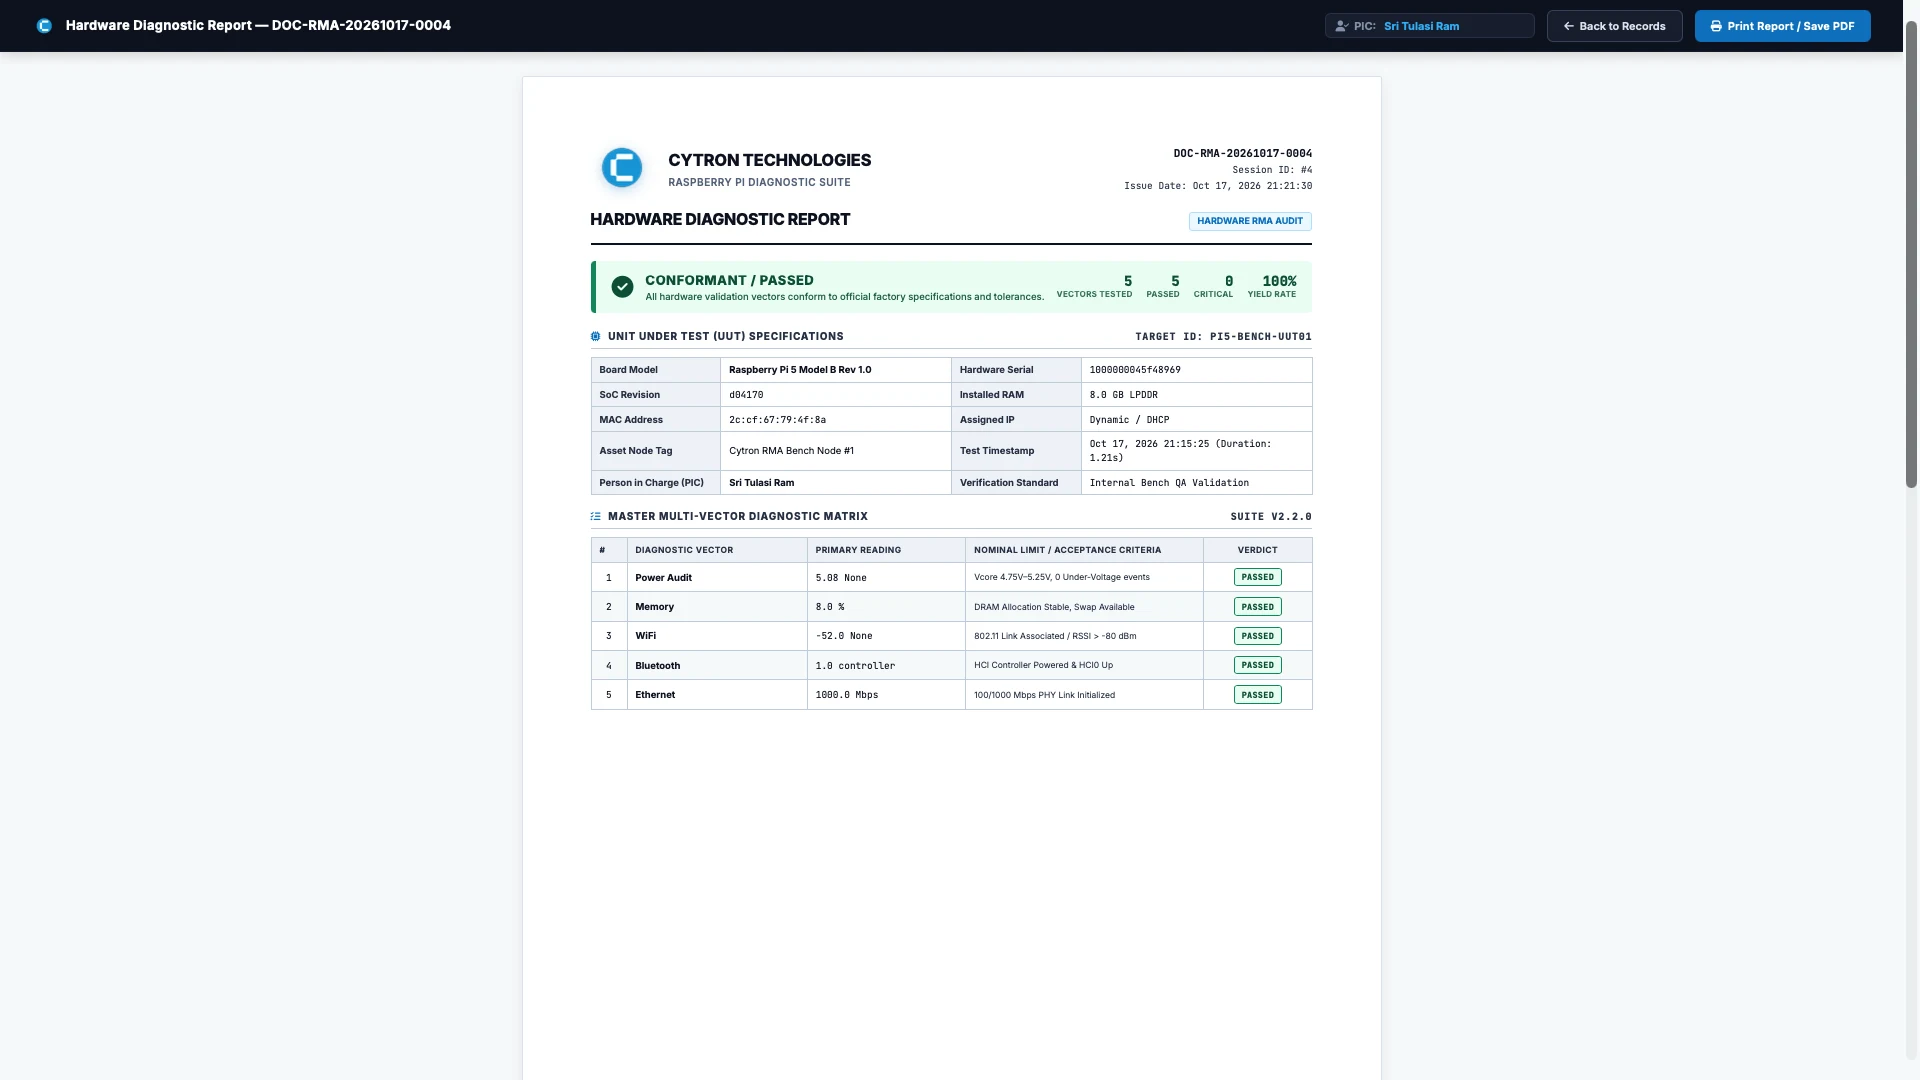
Report
The certificate, ready to print.
A reference ID, the unit’s spec sheet, a verdict and one row per test, with the person in charge named and a Print Report or Save as PDF button.
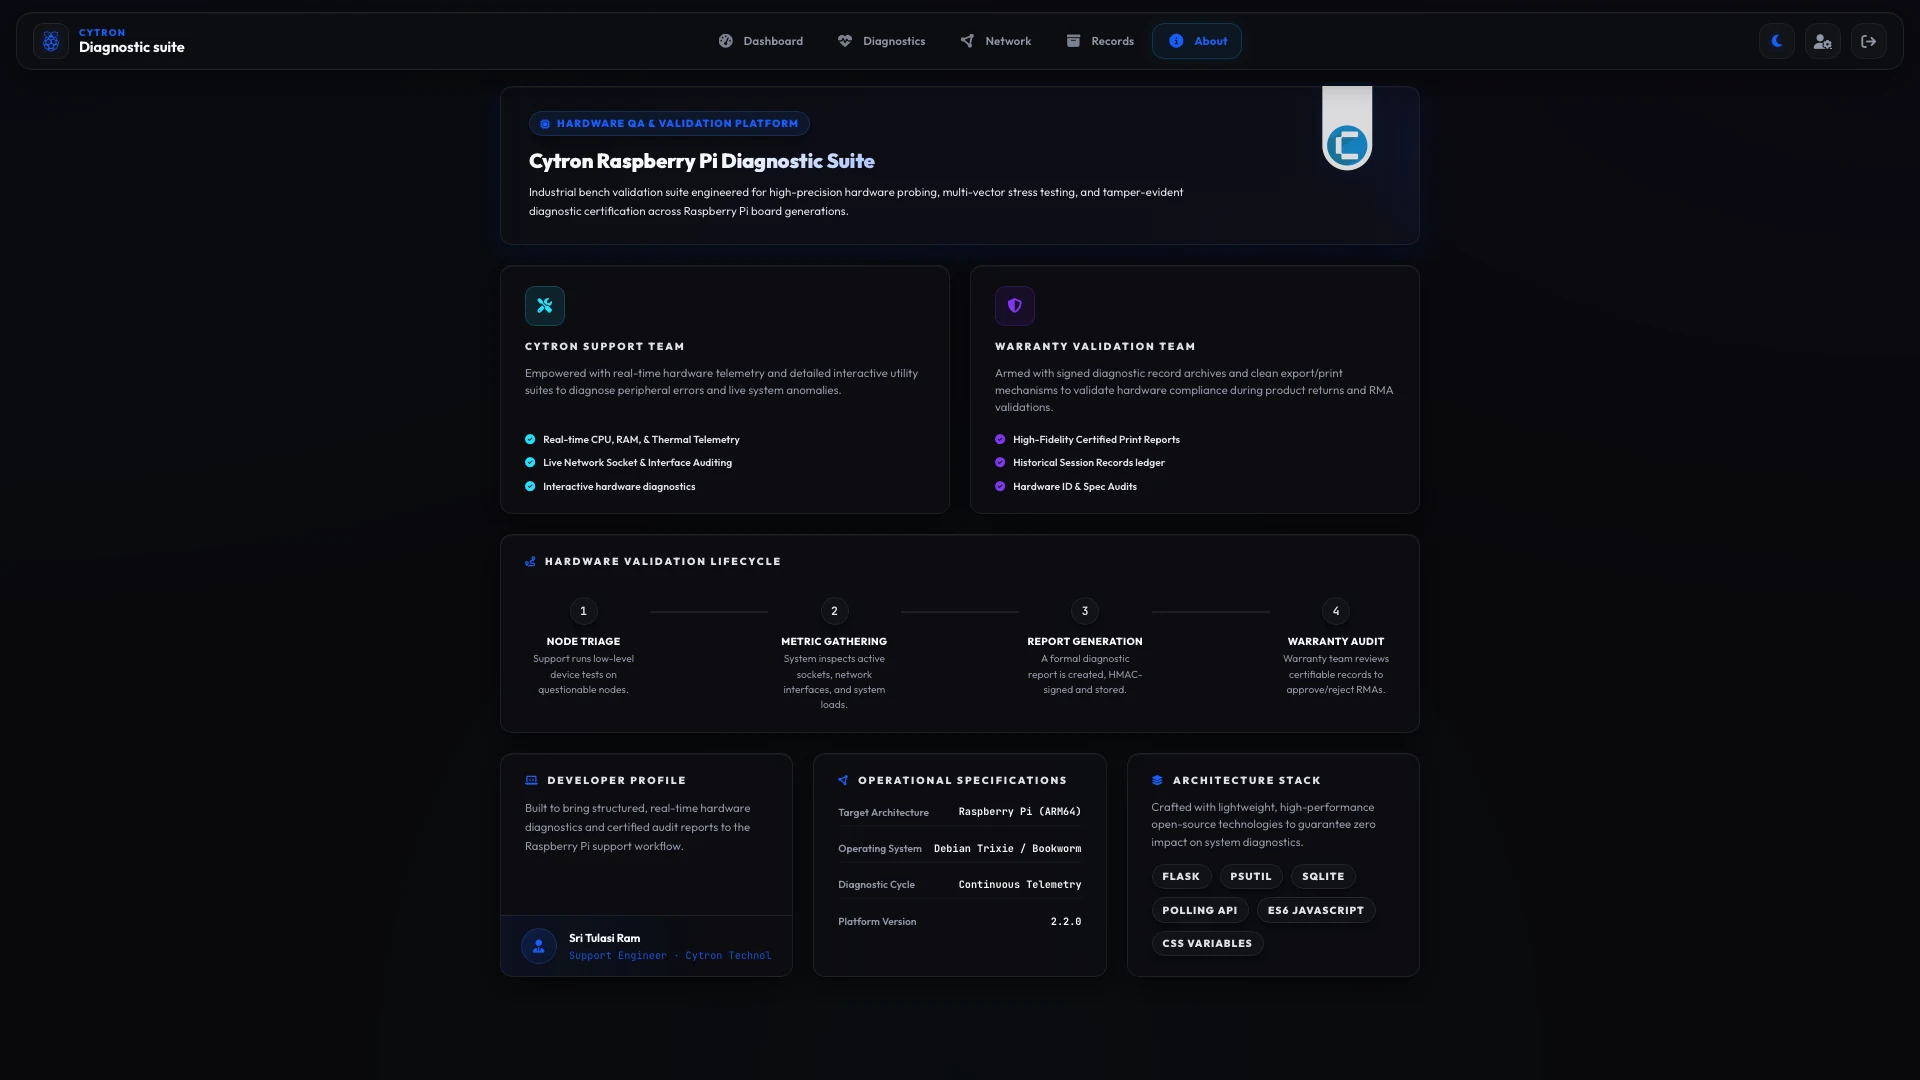
About
Built for the support team.
Live telemetry, interactive tests, signed records and printable reports, all following one four-step lifecycle from triage to report.
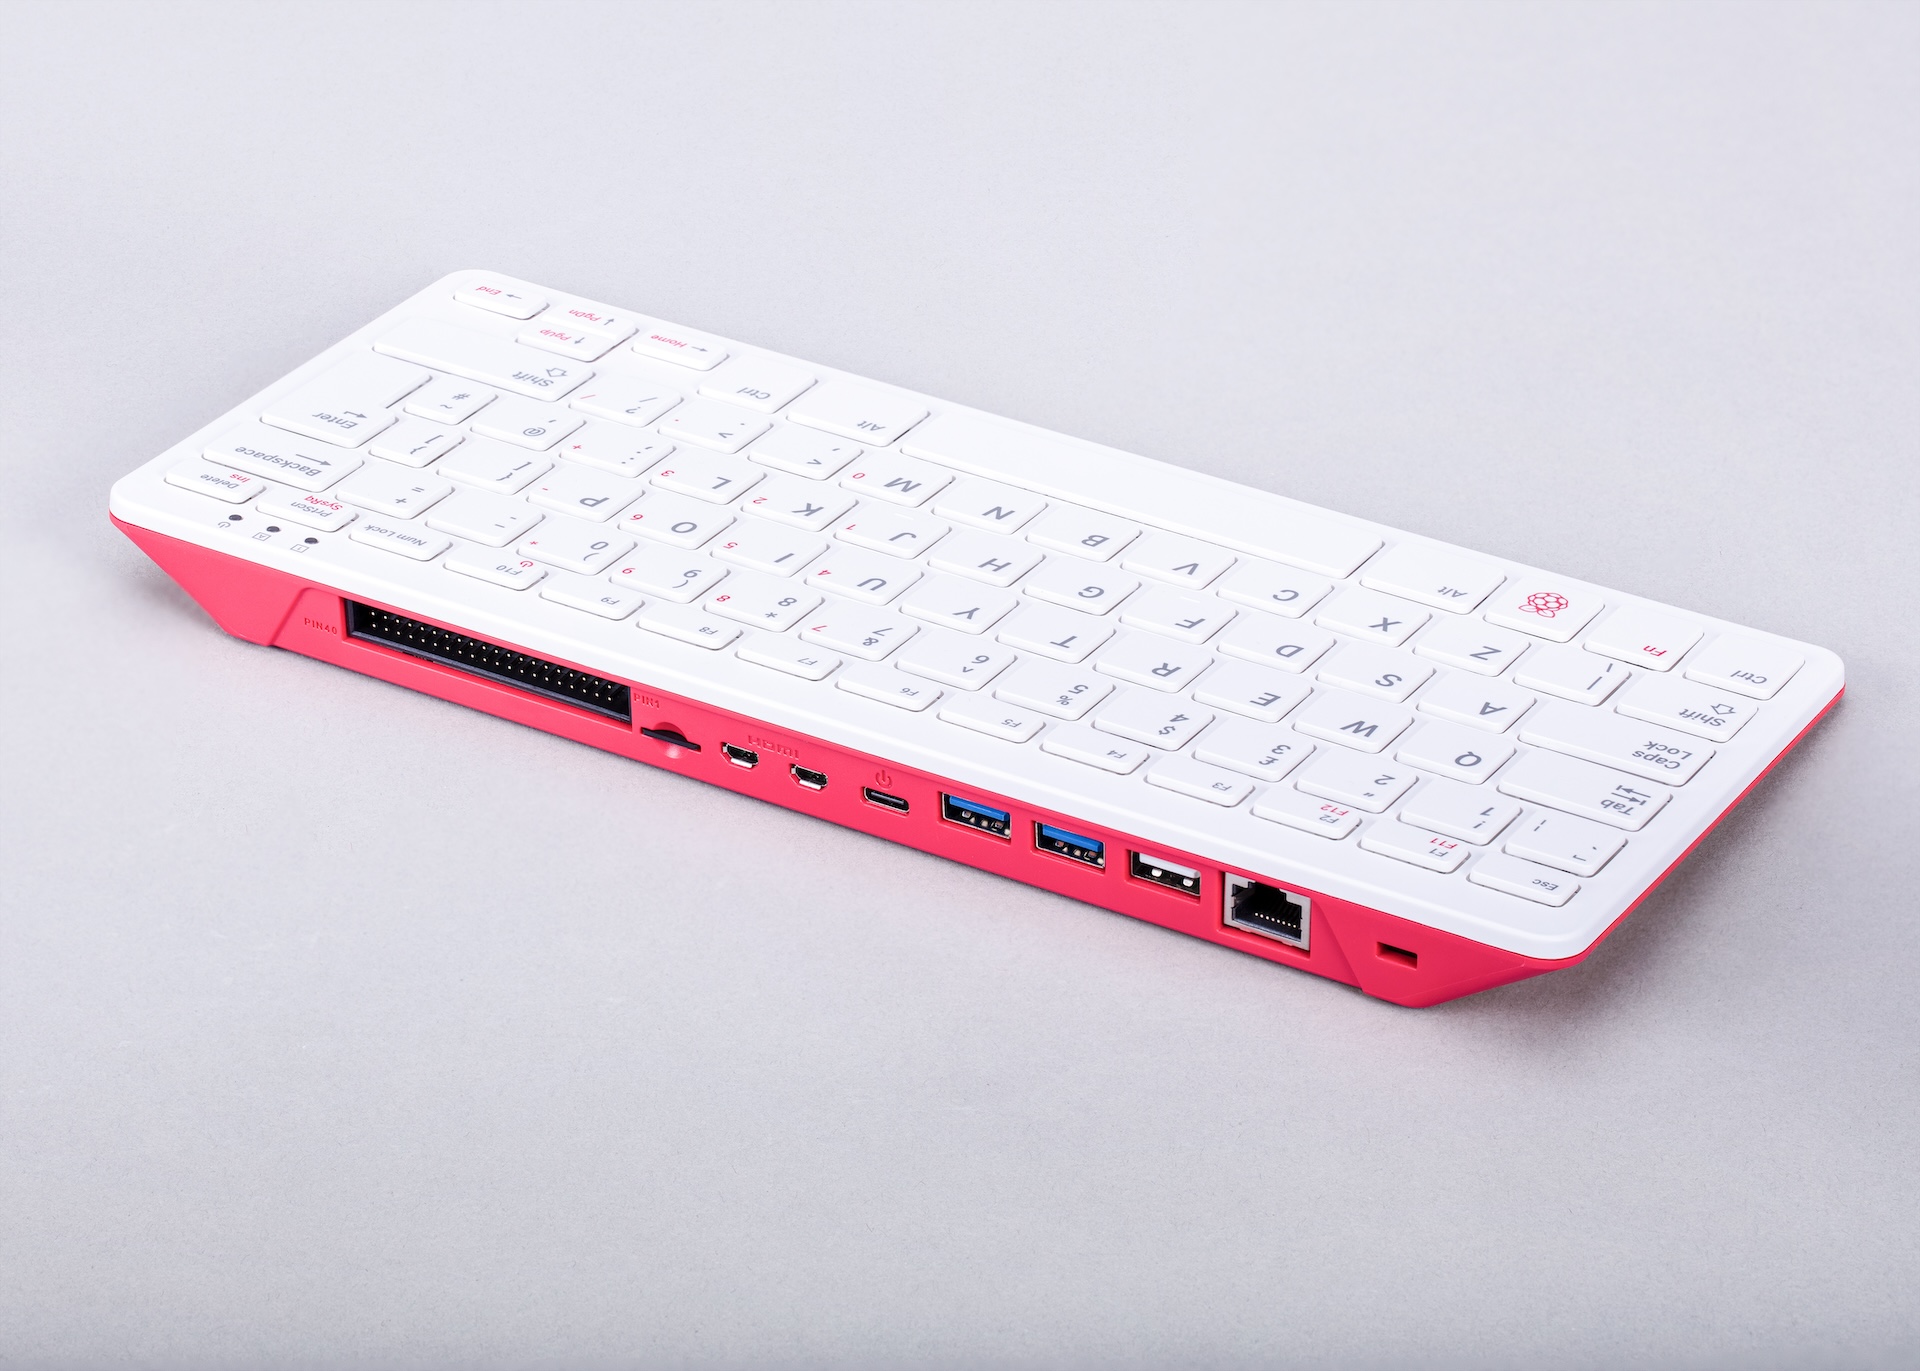
Works with the whole fleet.
From the Pi 5 to the Zero 2 W, one workbench handles whatever comes in.
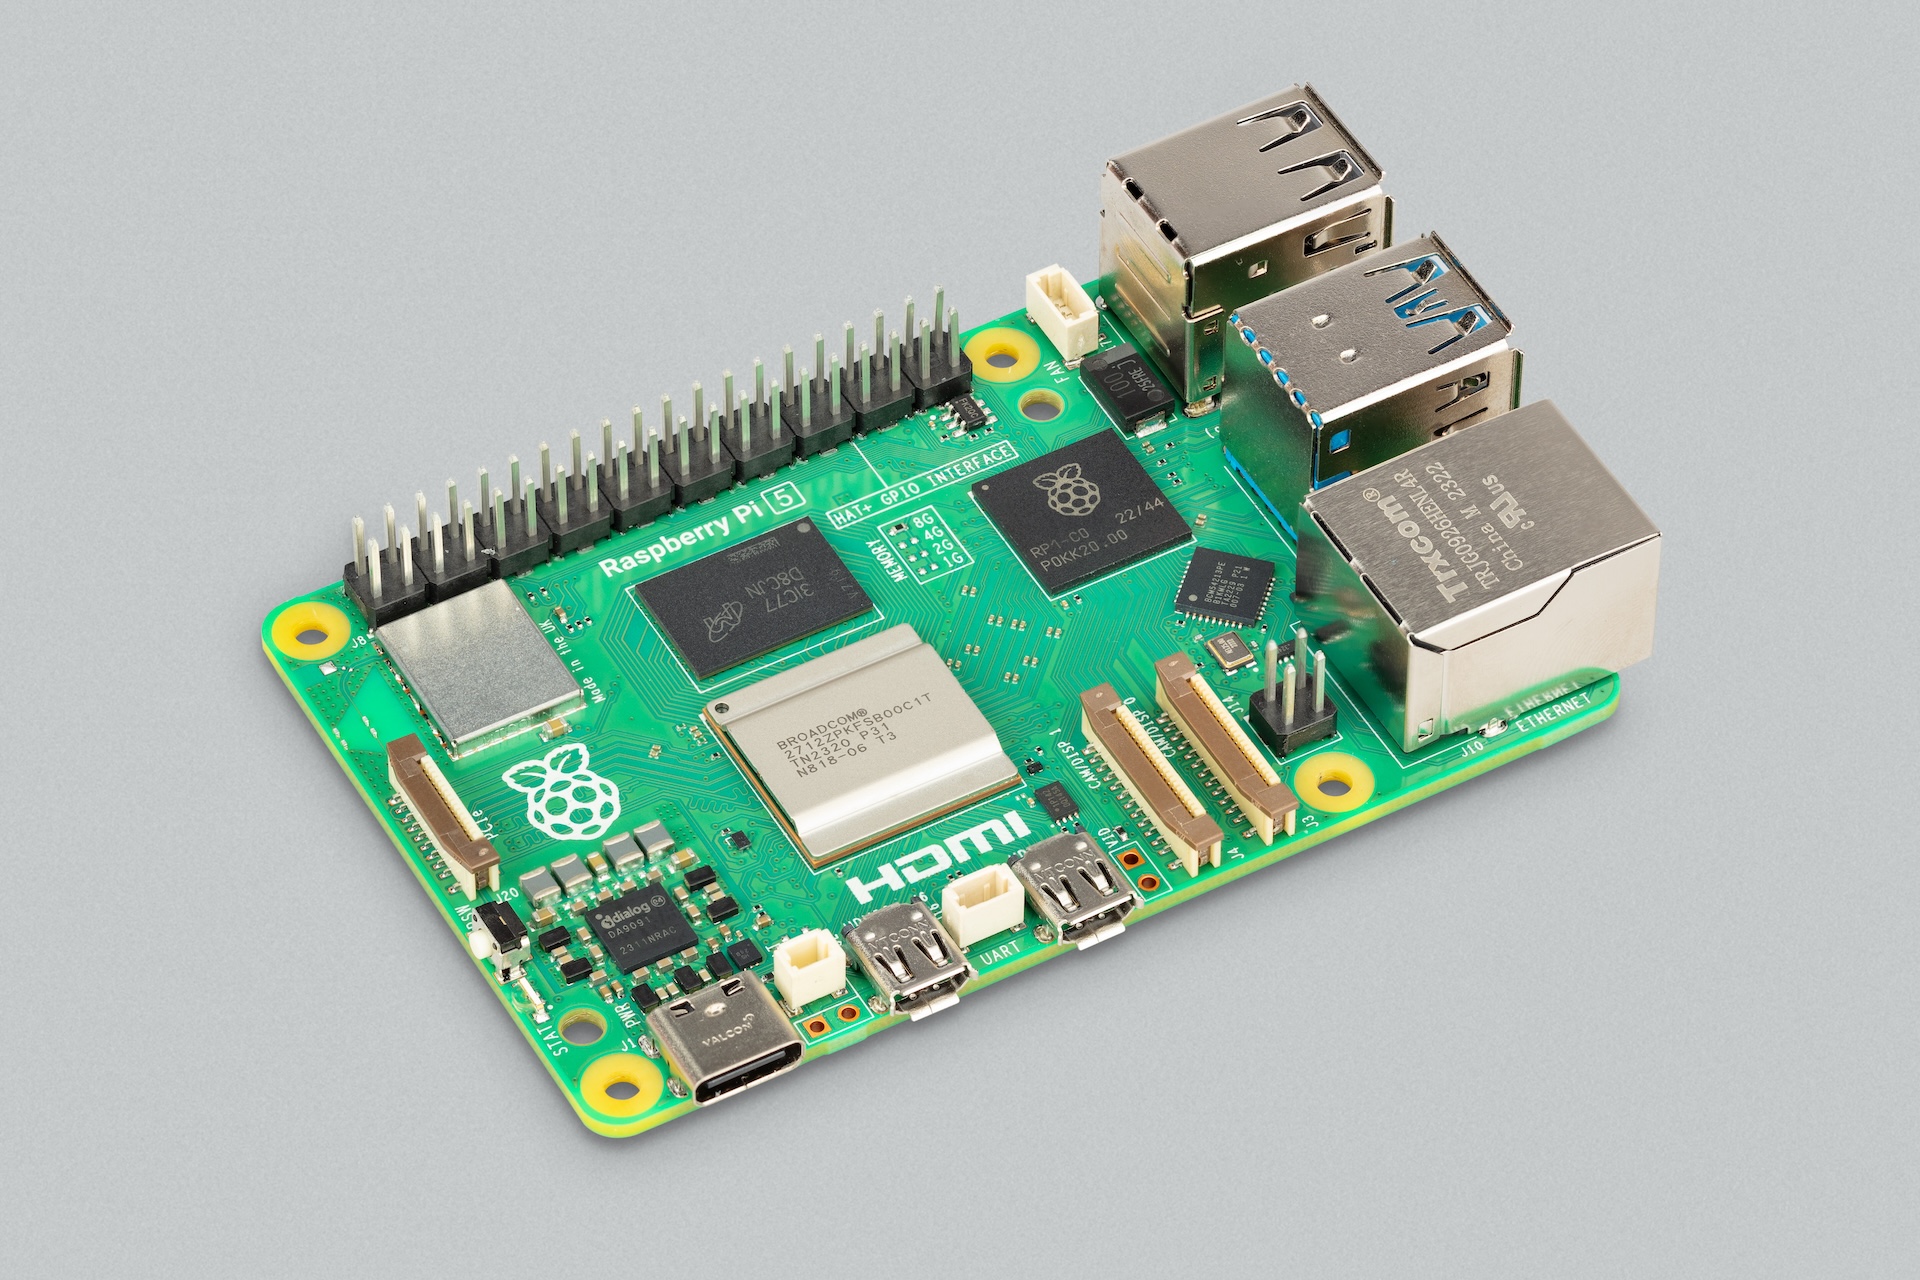
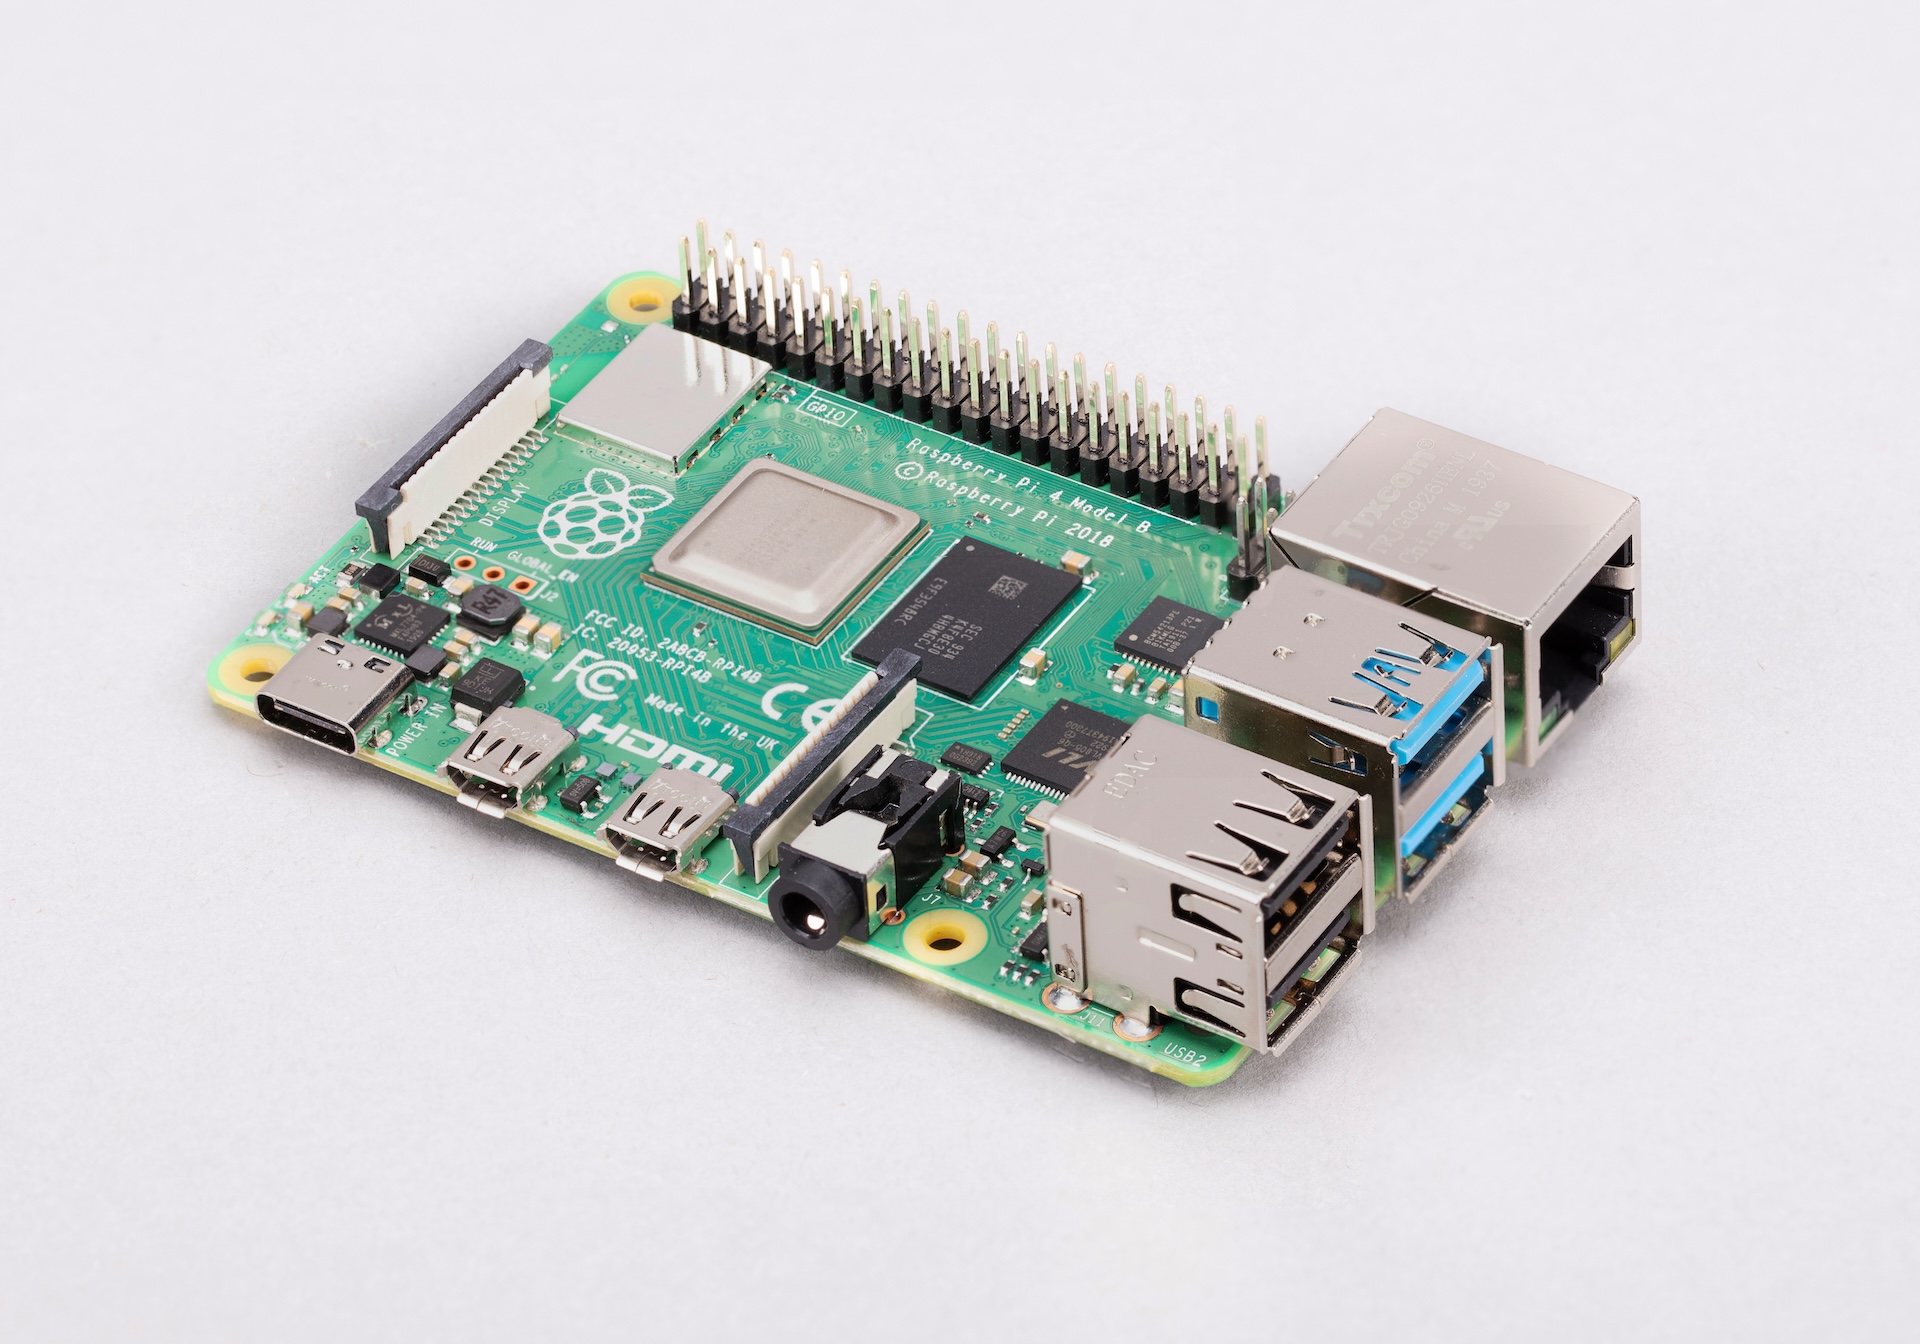
Raspberry Pi 5
BCM2712 · Cortex-A76
What the suite checks
- Direct lgpio probing on the RP1 (gpiochip4, 0, 1)
- PCIe Gen 2 / 3 link check
- Dual micro-HDMI display engines
- PMIC telemetry (DA9091)
Pi 2, Pi 1, Zero and Zero W run in passive mode: peripheral discovery, single-core load testing and firmware checks.
Built to hold up
Predictable under load.
- Diagnostic Vectors
- 19
- Automated checks across the platform, ports, radios, storage, compute and power.3
- Run Phases
- 4
- Network tests run apart from the storage tests, and the power audit runs alone, so neither distorts the other.4
- Per-Test Ceiling
- 180s
- A hung test is reported as failed and releases the hardware lock instead of freezing the run.5
Keep exploring.
Tech Specs
Want the details?
Every setting, limit and component, grouped and searchable by section.
Learn moreCompare
How does it stack up?
See this project next to the other two, side by side.
Learn moreNext project
IoT-Based Fertiliser Mixing for Precision Farming
Research Publication · International Journal of Integrated Engineering (UTHM)
Learn more- 1.An estimate of the previous manual process. The automated sweep has not been timed since the four-phase run plan was introduced.
- 2.The seal is an HMAC-SHA256 over the whole record, keyed with the application’s secret. A printed report stops matching the stored record if results are edited afterwards.
- 3.Counted from the run plan in the diagnostics manager: 10 platform and port tests, 3 radio and network, 3 storage, and 3 compute and power.
- 4.The storage tests run in their own phase, apart from the network tests, and the power audit runs alone after the compute sweep. Within the storage phase, its three tests run together.
- 5.Each test runs in its own thread with a 180-second limit. If it hangs, it is reported as failed and the hardware lock is released.