Peer-reviewed · IJIE Vol. 18(1), 2026
Nutrients, to the millilitre.
ESP32 firmware for automated hydroponic fertiliser dispensing, 30-point median-filtered TDS sensing, and real-time Blynk cloud telemetry.
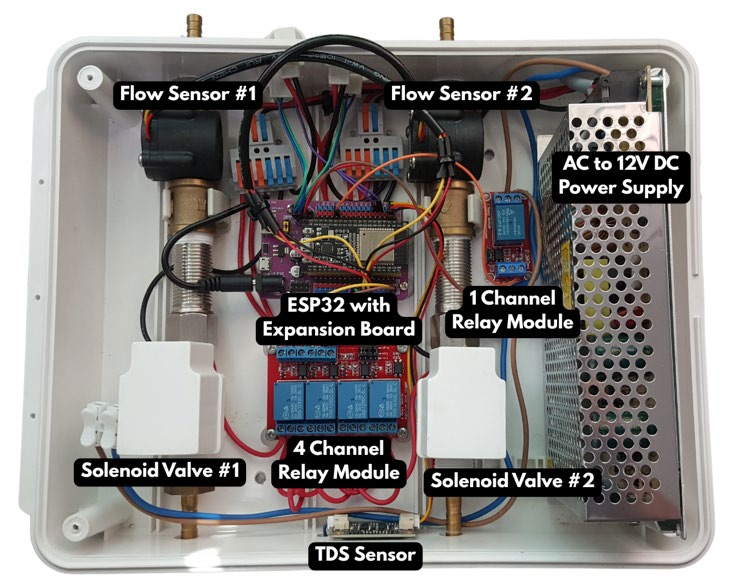
A blocking delay stalls the board.It never stops listening.
Long dispensing cycles used to trip the watchdog timer and drop the connection. Version 1.1.0 swaps blocking delays for an asynchronous state machine, so the Blynk heartbeat keeps running while it samples.
- 1Boot & cloud handshakeWi-Fi, Blynk token, safe-low GPIO, ISRs
- 240 ms ADC samplingCircular buffer, 30-sample median
- 3Atomic flow meteringSolenoids and pumps run on command
- 4Independent pump cut-offEach pump stops at its own target
Pumps that overshoot.Each pump stops on its own.
Hardware interrupts count pulses from each flow sensor and switch its pump off the moment its target volume is reached. There is no volumetric overshoot, and the solenoids close with the pumps.
- Flow sensors5.25 and 5.50 ml per pulseGPIO 18 & 19
- Dosing pumpsSwitched off independentlyGPIO 16 & 17
- Anti-backflow solenoidsClose with the pumpsGPIO 22 & 23
- Pulse counts are read inside atomic guards, so a multi-byte count is never torn.
A noisy electrode.Thirty samples, one clean reading.
Pump motors spike the analog line. A circular buffer collects a sample every 40 ms, and a 30-sample running median strips the spikes before a third-order polynomial turns voltage into ppm.
Equation (1) · IJIE 2026, p. 191
Median-filtered- V, compensated voltage.
- The voltage from the TDS sensor, after median filtering.
- F, calibration factor.
- Set against a standard solution at a fixed ppm before each evaluation.
See it in action.
HYDRA: Hydroponic Yield Driven Real-time Automation
IoT-Based Fertiliser Mixing System Prototype Demonstration
See how it’s built.
Three figures from the published paper.
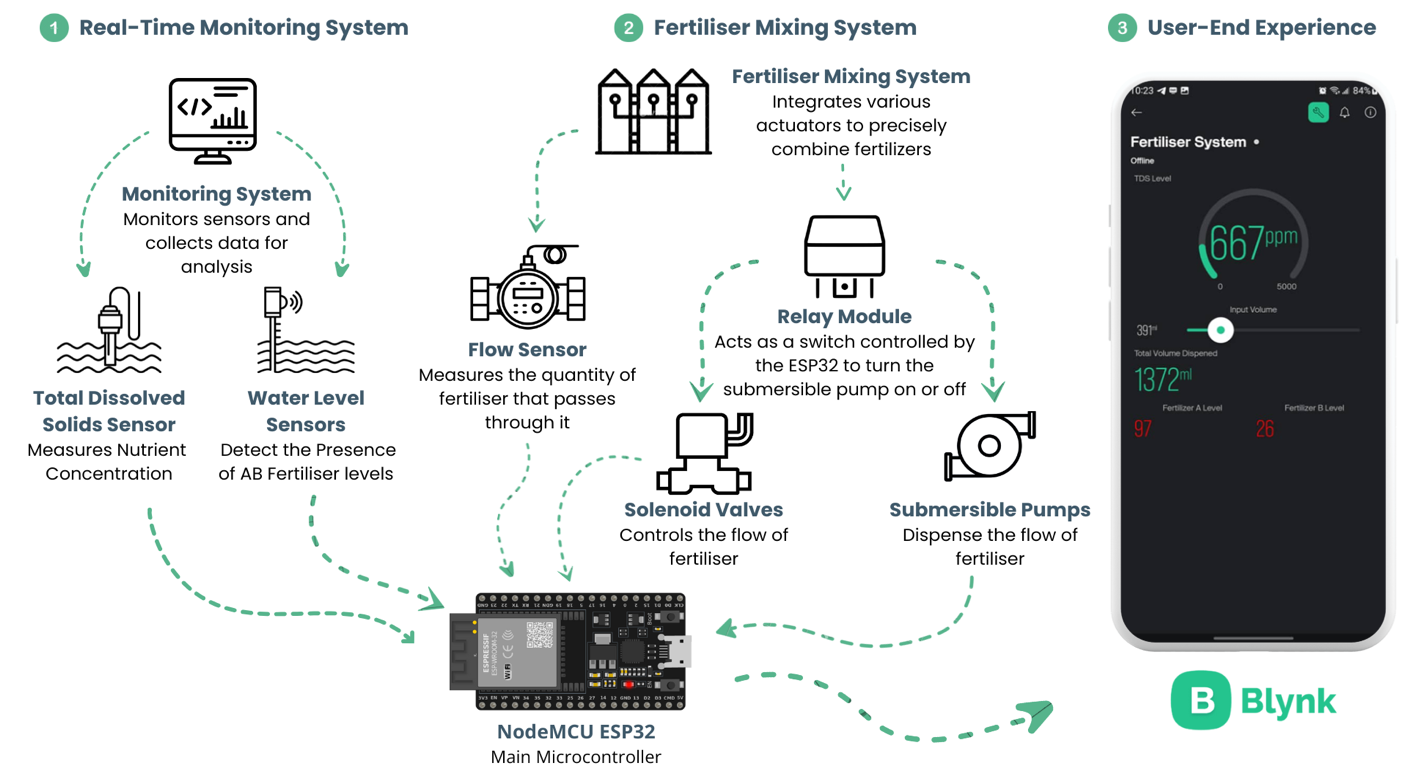
Architecture
Three processes, one closed loop.
Real-time monitoring, fertiliser mixing and the user interface, joined around a NodeMCU ESP32 that reads the sensors and drives the pumps and valves.
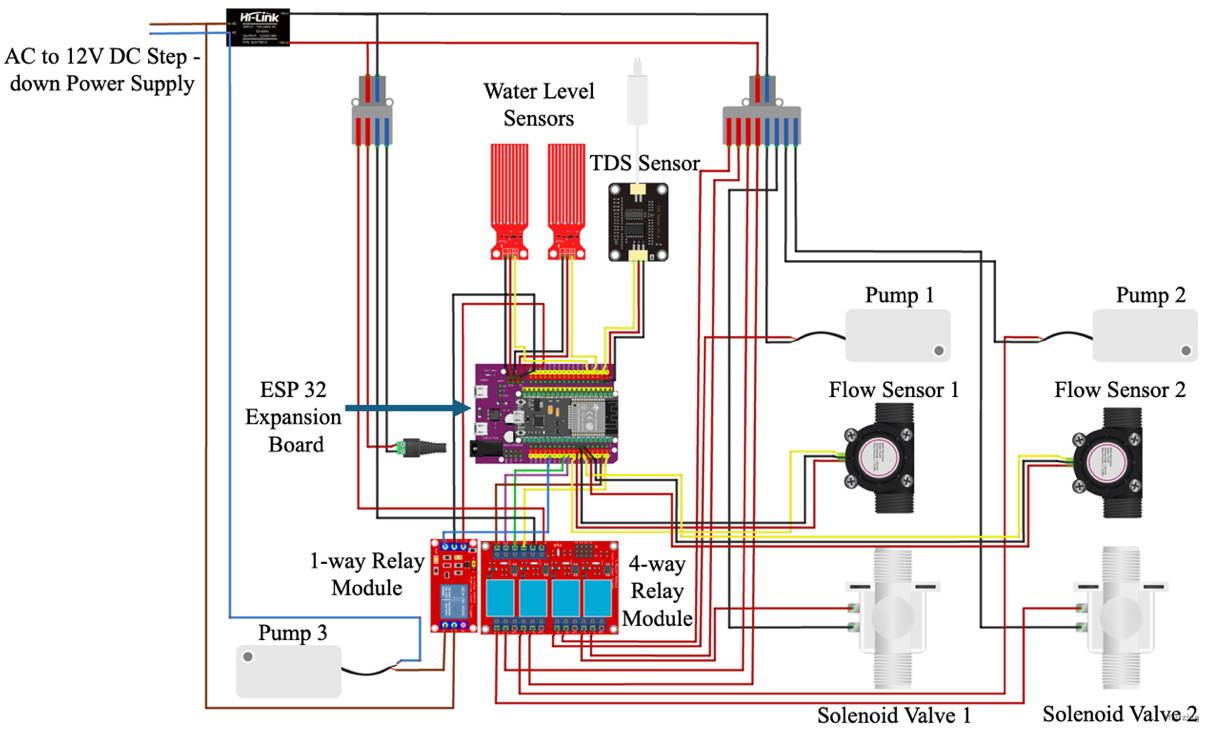
Circuit
The full wiring, on one page.
The ESP32 expansion board, relay modules, an AC-to-12 V power supply, the TDS and water-level sensors, flow sensors, pumps and solenoid valves.
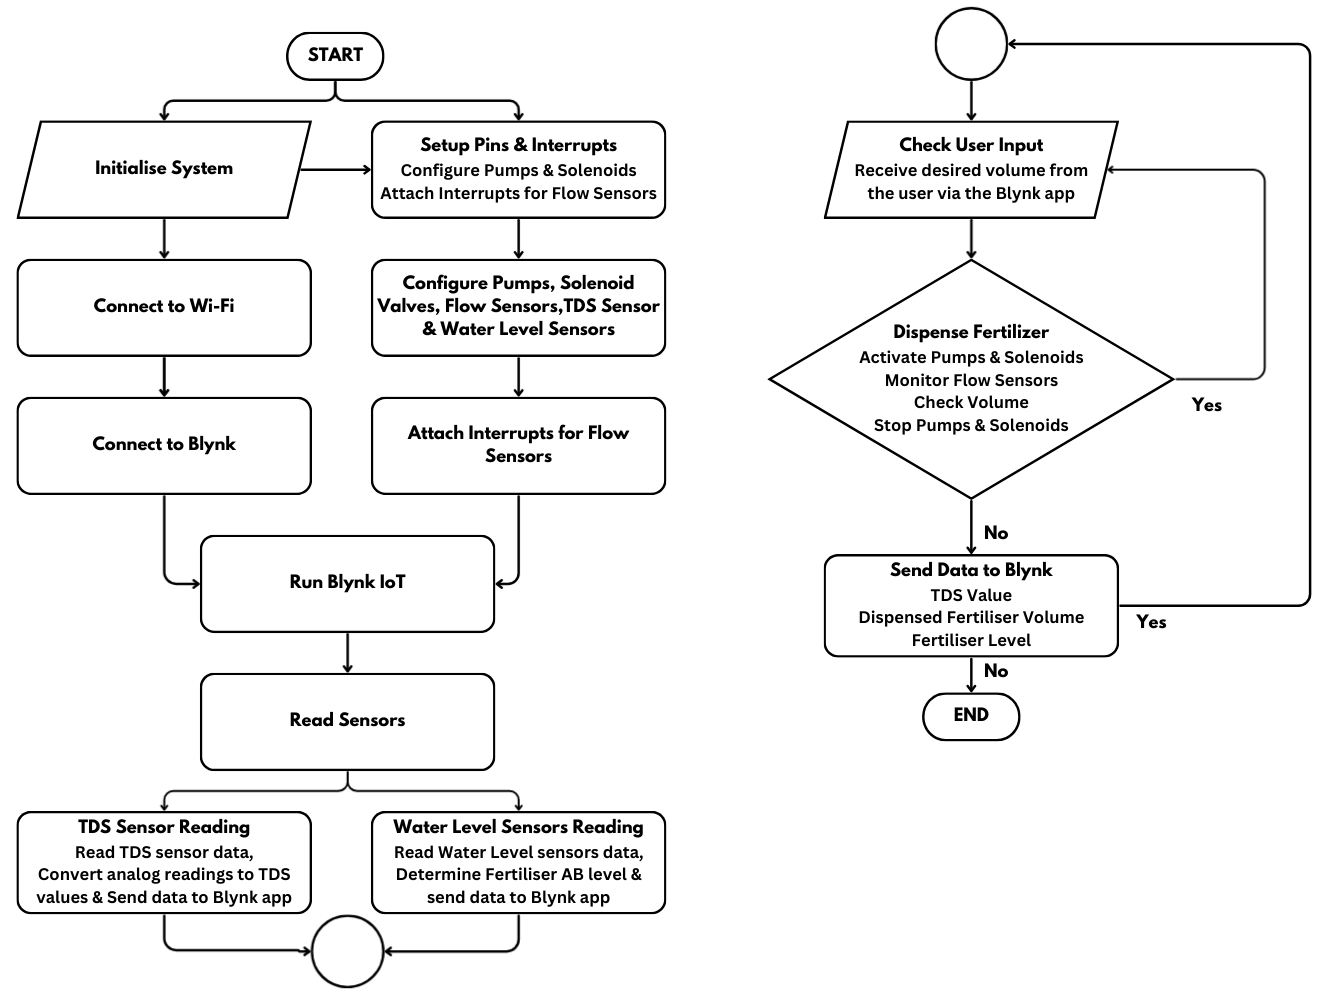
Workflow
A flowchart of the loop.
The decisions and operations of the code, from reading the sensors to acting on a command from the Blynk app.
Tested five ways.
Each subsystem was measured against a reference, as documented in the International Journal of Integrated Engineering.
Test 1 of 5
TDS accuracy.99.6% across four concentrations.
The TDS sensor against a calibrated TDS meter, at four solution strengths made by diluting a 900 ppm fertiliser AB solution. Each was measured three times.
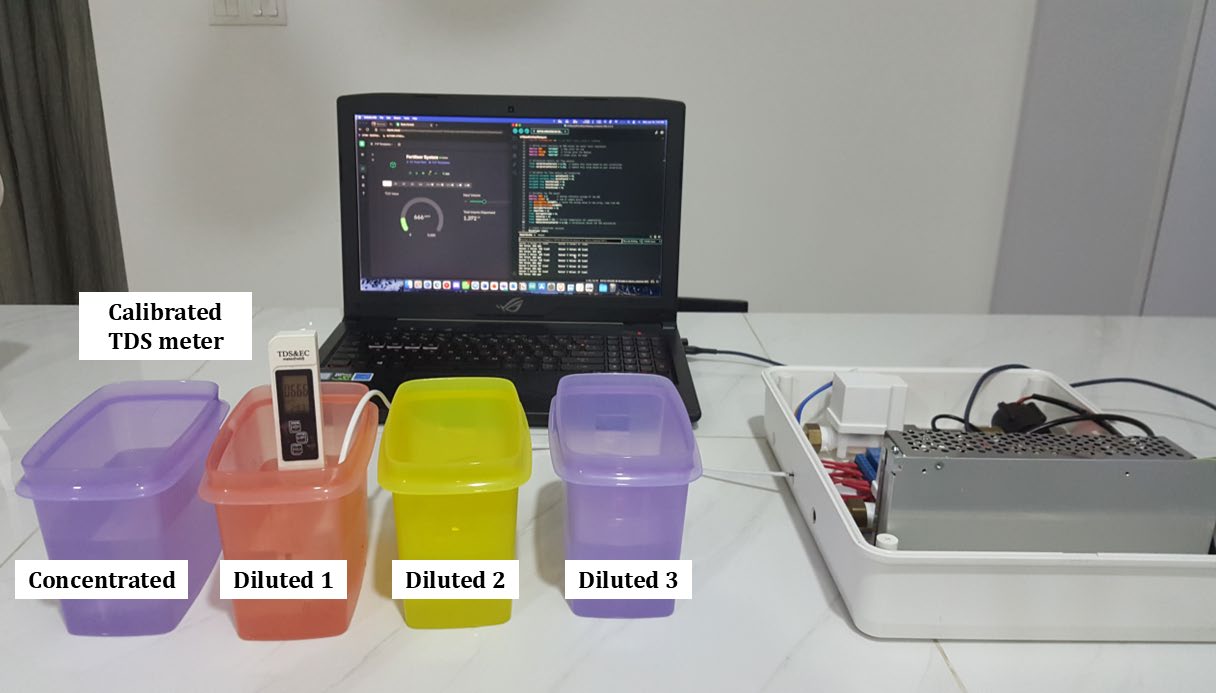
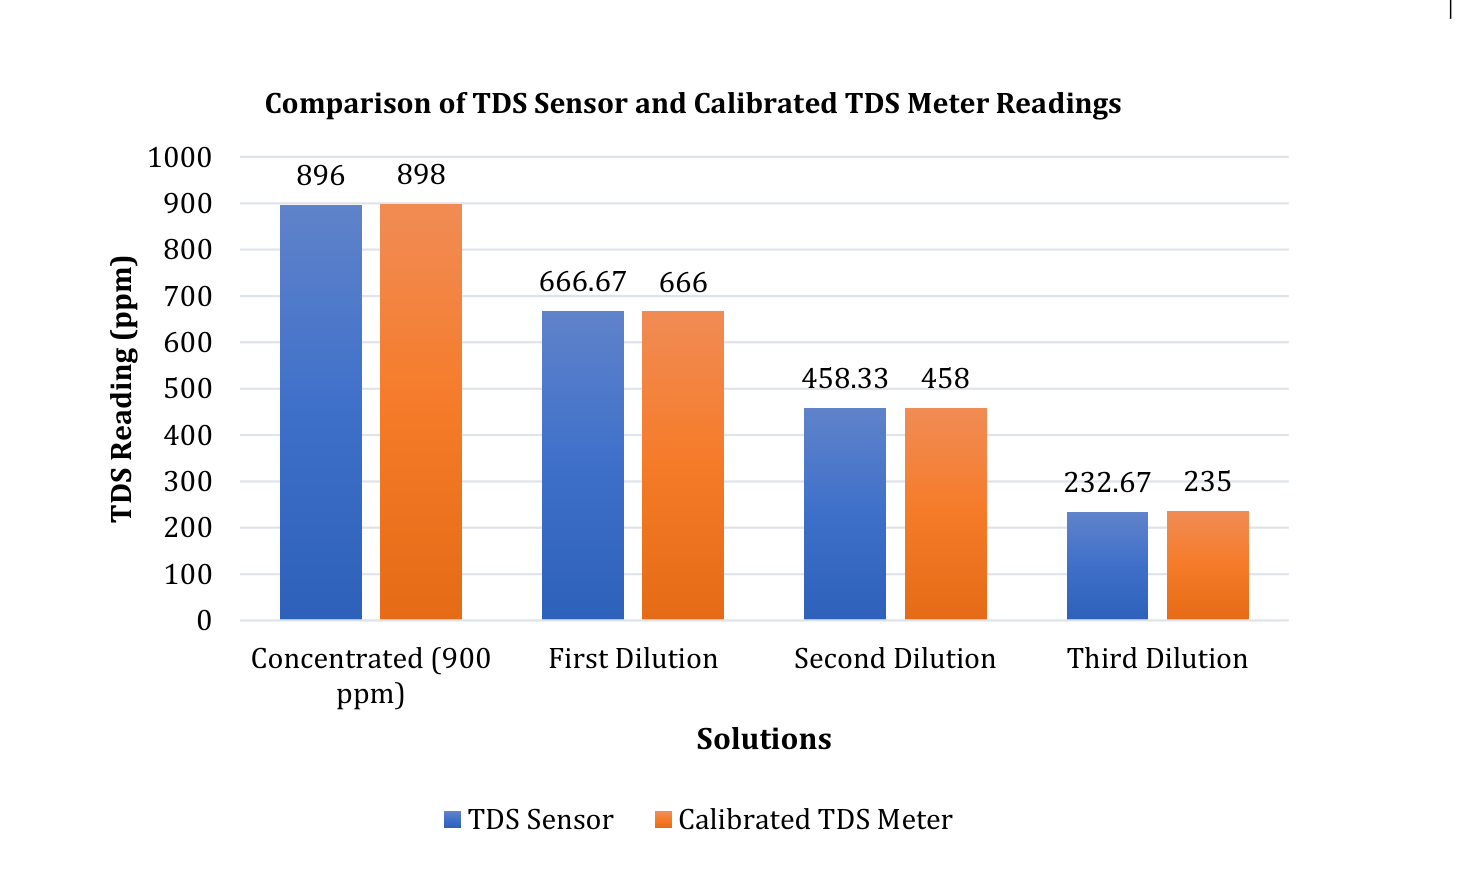
- 99.56%
- 896.0 vs 898 ppm
- Concentrated, 900 ppm
- 99.90%
- 666.7 vs 666 ppm
- First dilution
- 99.93%
- 458.3 vs 458 ppm
- Second dilution
- 99.01%
- 232.7 vs 235 ppm
- Third dilution
Mean accuracy of 99.60% across all four, with a maximum deviation of 4.0 ppm.
Test 2 of 5
Calibration stability.Seven days, under 2% drift.
A mineral-water reference labelled 258 ppm, measured at the same time every day for seven days and compared with the initial calibration value.
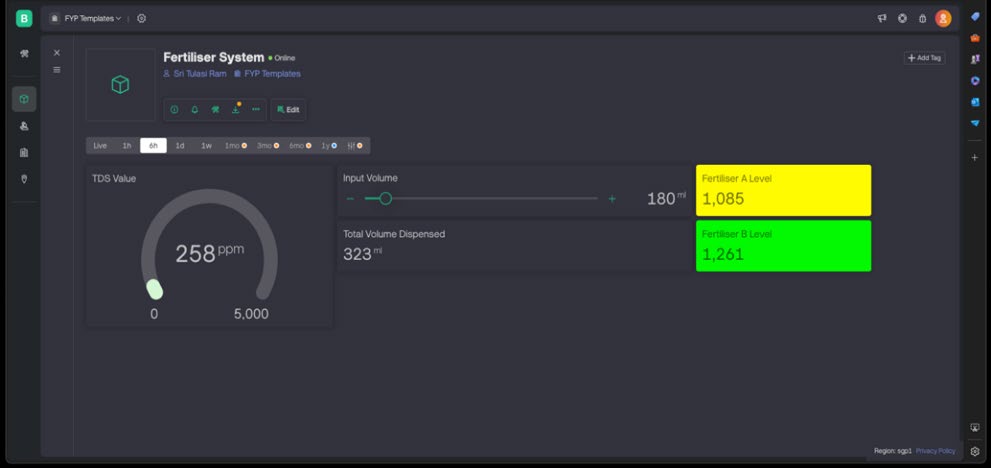
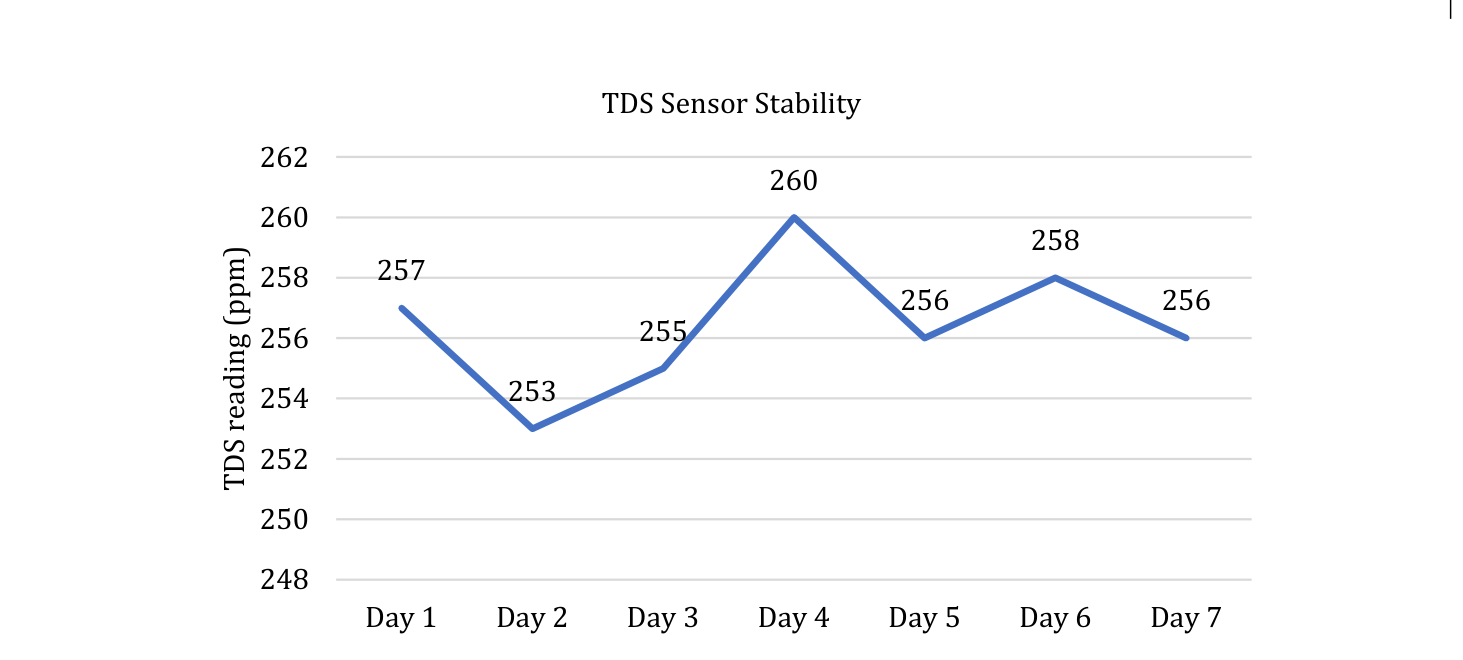
- 256.4 ppm
- 7-day mean reading
- Reference standard: 258.0 ppm
- 1.94%
- Maximum drift
- Observed on day 2, at 253 ppm
- 0.00%
- Drift on day 6
- An exact match with the initial calibration
Readings stayed within 2% of the initial 258 ppm calibration for the whole week.
Test 3 of 5
Flow precision.94% or better at every volume.
Both flow sensors across four target volumes, 250, 500, 750 and 1,000 ml. Tap water stood in for fertiliser, and each dose was checked in a calibrated container, three times.
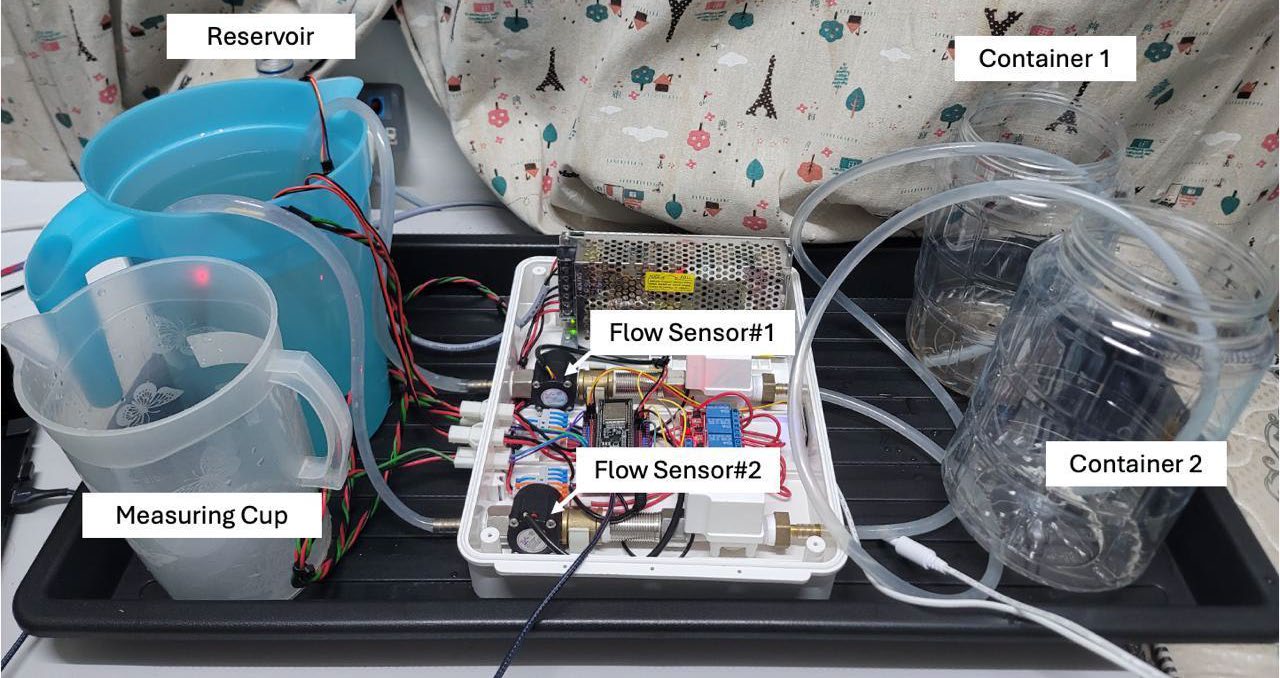
- 97.18%
- Flow sensor 1, mean precision
- 235.0 ml at 250 (94.00%) · 478.3 at 500 (95.66%) · 746.6 at 750 (99.54%) · 995.0 at 1,000 (99.50%)
- 97.90%
- Flow sensor 2, mean precision
- 236.7 ml at 250 (94.68%) · 501.7 at 500 (99.66%) · 756.7 at 750 (99.10%) · 1,018.3 at 1,000 (98.17%)
Both sensors reached 94% accuracy or better at every volume tested.
Test 4 of 5
Concentration adjustment.From 103 to 800 ppm, step by step.
Measured amounts of concentrated AB fertiliser, 200, 300, 400 and 500 ml, added in turn to a hydroponic water store and mixed, with the sensor checked against a calibrated meter after each.
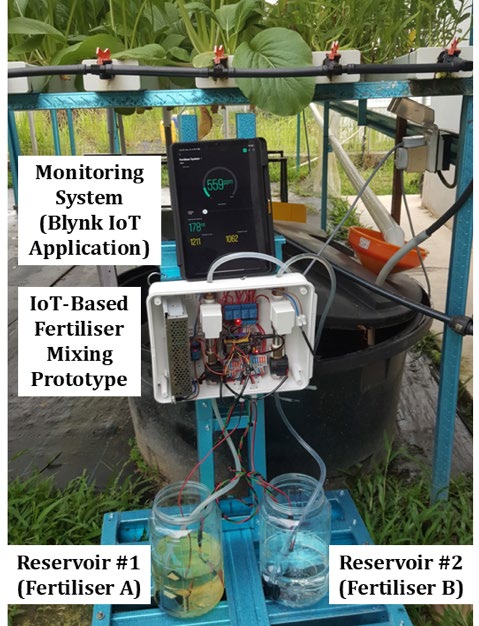
- 96.00%
- 103 → 200 ppm
- 200 ml added · 187 ppm sensor, 192 meter
- 98.75%
- 192 → 400 ppm
- 300 ml added · 392 ppm sensor, 395 meter
- 92.83%
- 395 → 600 ppm
- 400 ml added · 559 ppm sensor, 557 meter
- 95.50%
- 557 → 800 ppm
- 500 ml added · 769 ppm sensor, 764 meter
Between 92.83% and 98.75% of the target at every step. The readings rose almost linearly with each addition.
Test 5 of 5
Response time.22.17 seconds, tap to delivery.
From a command in the Blynk app to the system acting on it, timed with a stopwatch over three trials per action.
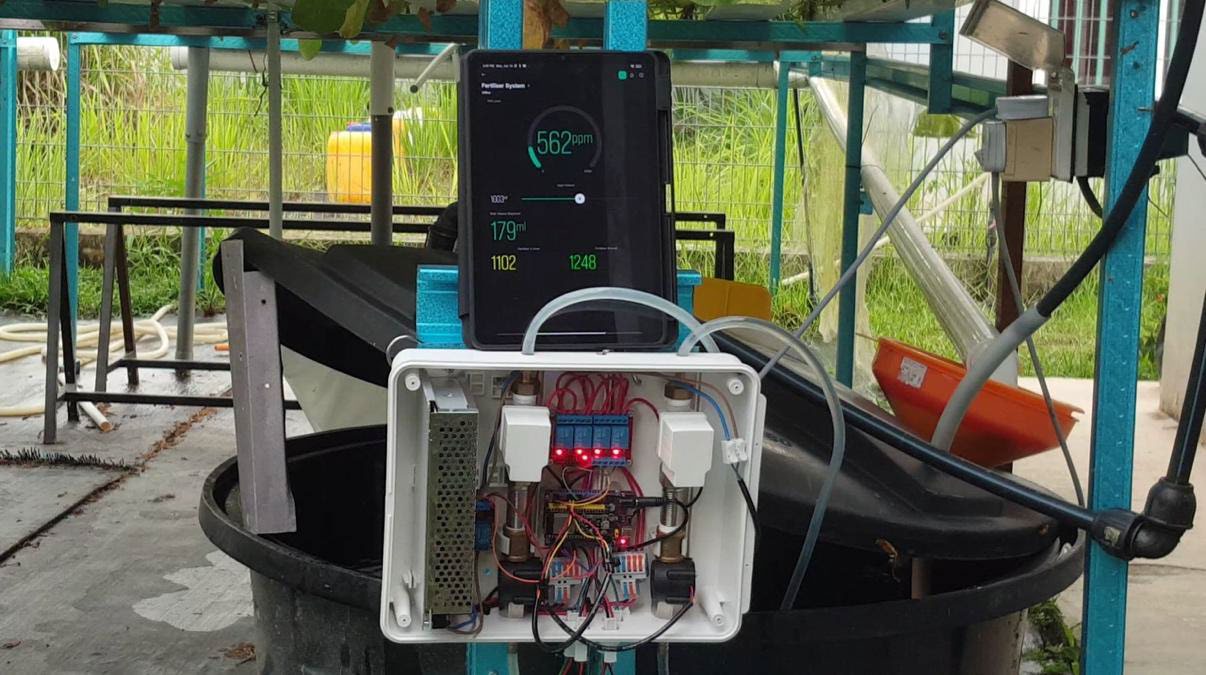
- 10.85s
- Solenoid valves open
- Average of three trials
- 1.07s
- Pump activation
- Average of three trials
- 10.79s
- Fertiliser dispensed
- Average of three trials
- 22.17s
- Total response time
- From the command being issued
A slight delay shows up during dispensing, but the system reacts quickly to user commands.
The headline numbers
Precise, and peer-reviewed.
- TDS Precision
- 99.6%
- Mean accuracy against a calibrated TDS meter across four standard solutions, from about 230 to 900 ppm.
- Dosing Accuracy
- > 94%
- Interrupt-driven flow sensor calibration maintained >94% dosage precision across 250–1,000 ml dispenses.
- IJIE Journal
- Vol. 18(1)
- Published research paper: pp. 186–201, International Journal of Integrated Engineering (2026). DOI: 10.30880/ijie.2026.18.01.014.
Peer-reviewed · Scopus and MyCite indexed · Open access
IoT-Based Fertiliser Mixing for Precision Farming.
Sri Tulasi Ram Rajalingam (first and lead author), Muhammad Muzakkir Mohd Nadzri, Afandi Ahmad (corresponding author) and Mohamad Khairi Ishak.
Faculty of Electrical and Electronic Engineering, Universiti Tun Hussein Onn Malaysia (UTHM). Co-author affiliation: Department of Computer Engineering, University of Sharjah.
International Journal of Integrated Engineering, Vol. 18, No. 1 (2026), pp. 186–201. DOI 10.30880/ijie.2026.18.01.014
@article{rajalingam2026iot,
  title     = {IoT-Based Fertiliser Mixing for Precision Farming},
  author    = {Rajalingam, Sri Tulasi Ram and Nadzri, Muhammad Muzakkir Mohd and Ahmad, Afandi and Ishak, Mohamad Khairi},
  journal   = {International Journal of Integrated Engineering},
  volume    = {18},
  number    = {1},
  pages     = {186--201},
  year      = {2026},
  publisher = {Penerbit UTHM},
  doi       = {10.30880/ijie.2026.18.01.014},
  url       = {https://doi.org/10.30880/ijie.2026.18.01.014}
}